Key Takeaways
- By diving into Agency Analytics alternatives, agencies can break free from price, customization, and feature limitations — creating reports that are more efficient and more impactful.
- Evaluating flat rates, free plans, and more can help agencies optimize their budget and invest in sustainable growth without compromising on critical functionality.
- Customization and white-labeling capabilities are important for agencies to provide custom, branded reports that build client relationships and trust.
- Focusing on easy-to-use interfaces and strong automation can help you increase your productivity, streamline your workflow, and generate insights quickly.
- Thinking through aspects such as scalability, integration quality, and customer support helps guarantee your selected tool will grow with your agency’s needs and enable your team to thrive.
- KPI-centric tools and alternatives like KPI.me provide purpose-built, user-friendly reporting that enables agencies to monitor objectives, optimize decisions, and prove tangible value to their clients.
Agency analytics alternatives provide SEO squads with additional means to monitor, report, and analyze their work. Most tools now have transparent dashboards, rapid data pulls, and simple report sharing.
Some specialize in custom views, others in powerful link tracking or deep keyword auditing. All have their place, and each one fits different needs and budgets.
Selecting the right tool is a step toward working smarter as a team! Below are our top picks and what sets each apart.
Why Seek Alternatives?
Agency Analytics is a popular platform for agencies to monitor and report on campaign metrics, but numerous users encounter barriers that drive them to explore agency analytics alternatives. Expensive, friction-filled feature rigidity and lack of deeper customization frequently lead teams to seek an excellent agency analytics alternative. For agencies attempting to scale or provide more value to clients, these cracks can hinder growth and make reporting less impactful.
Pricing Models
Agency Analytics has a per-campaign pricing model, so fees accumulate quickly as agencies onboard new clients or want to monitor additional campaigns. Certain alternatives, such as Whatagraph or Data Studio, have flat rates or even free tiers with basic functionality. This can be a huge differentiator for smaller agencies or those on a budget, who can’t justify shelling out the increasing costs every time they scale.
In the long run, agencies on per-campaign pricing could potentially pay significantly more than those on a flat rate, particularly as their roster expands.
Customization Limits
One big issue with Agency Analytics is that it offers little scope to modify or brand reports for clients. Some agencies prefer to display their logo, choose their color scheme, and customize reports with distinctive metrics that are important for each client. Without such alternatives, reports can be a bit pedestrian.
Some rivals allow users to construct custom dashboards or add advanced filters for more detailed client insight. That not only assists with brand consistency but also increases client confidence, as they see reports that mirror their objectives and brand aesthetic.
Feature Gaps
|
Feature |
Agency Analytics |
Common Alternatives |
Impact |
|---|---|---|---|
|
Data Blending |
No |
Yes (e.g., Google Data Studio) |
Limits unified insights |
|
Advanced Calculations |
No |
Yes |
Hinders deep analysis |
|
AI Insights |
No |
Yes (e.g., DashThis) |
Slower to spot trends |
|
Integration Range |
Limited |
Broad (e.g., Supermetrics) |
Fewer data sources |
Lack of features leads to marketing agencies wasting time context-switching between tools or manually crunching numbers. Many agency analytics users crave automated reporting, smarter data management, and broader integrations, prompting them to seek excellent agency analytics alternatives for richer, speedier insights.
User Experience
For others, Agency Analytics is a steep learning curve, less friendly at times. When teams waste excessive time training on a platform, reporting is slow and error-prone. Easy-to-use tools, like Swydo or ReportGarden, enable teams to create reports quickly and with fewer mistakes.
A clean, simple interface translates into quicker onboarding for new hires and less stress all around.
Top 10 Agency Analytics Alternatives
Looking for better, more tailored reporting solutions than AgencyAnalytics? Here’s our detailed guide to the top 10 alternatives, covering features, strengths, and limitations, so you can choose the platform that fits your agency’s needs.
1. KPI.me
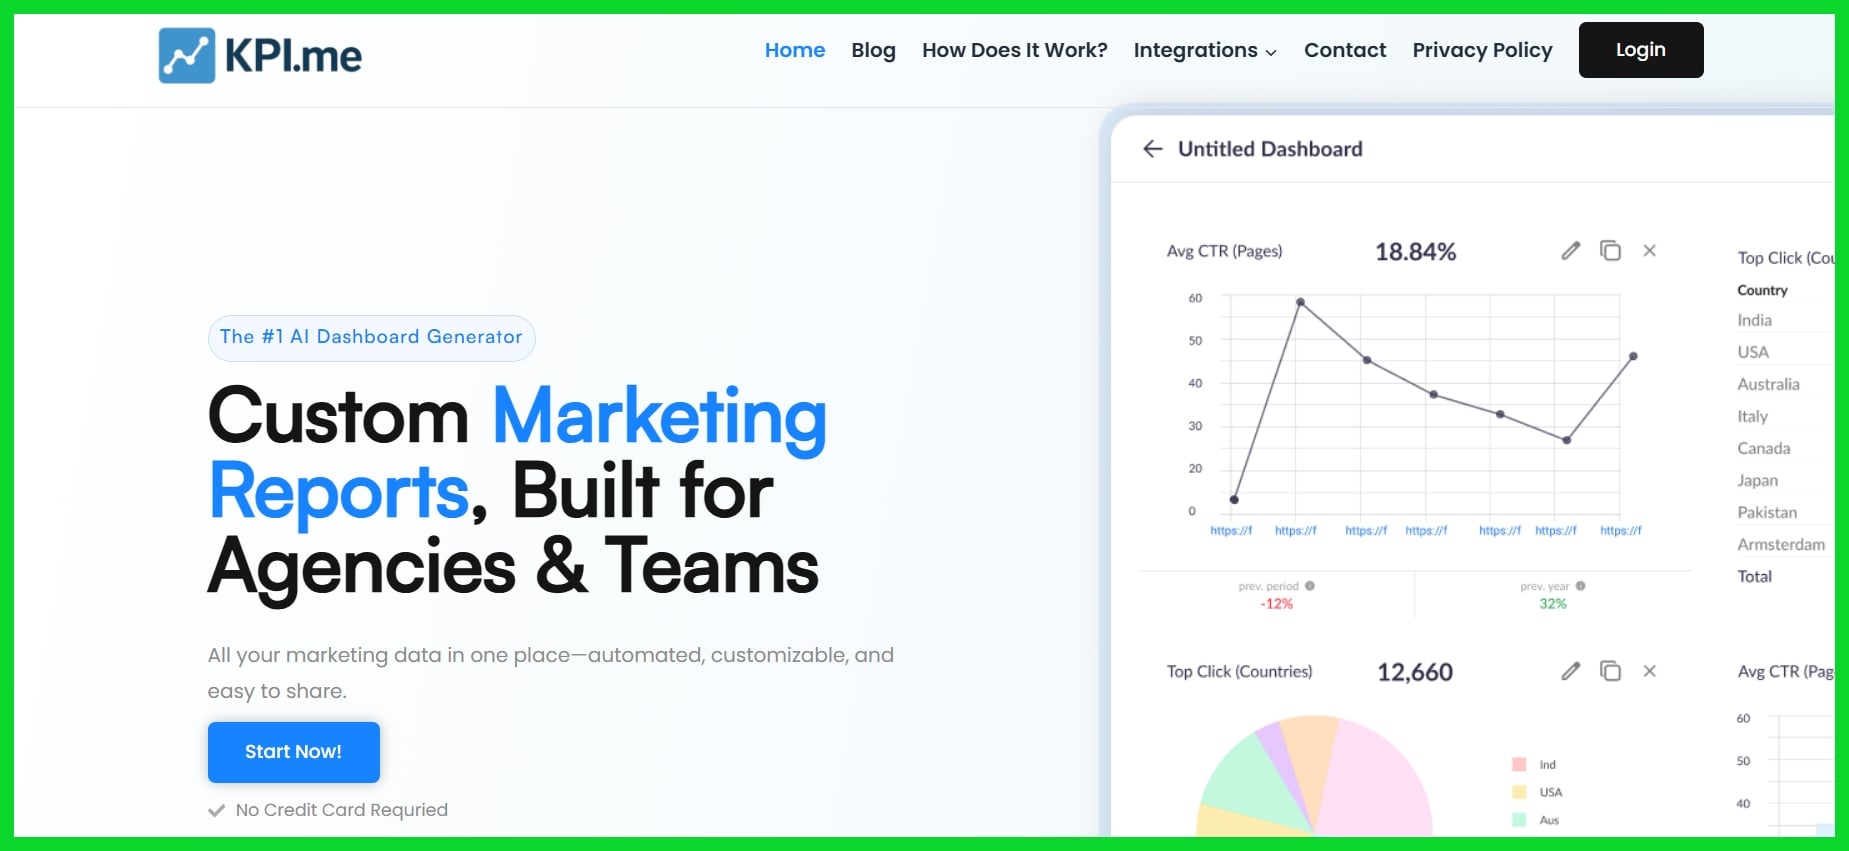
Key Features: White-label dashboards, real-time integrations (e.g., Google Analytics, Search Console), KPI widgets, multi-client scalability.
KPI.me is ideal for agencies that want full control over branding while keeping reporting simple and scalable. It stands out for its easy-to-use white-label features and flexible KPI dashboards. The platform supports key marketing integrations and is well-suited for SEO, PPC, and content-focused teams. While it’s a newer player in the space, its clean interface and affordable pricing make it a promising solution. However, because it’s relatively new, it may not yet have the extensive ecosystem or third-party integrations that more established platforms offer.
2. Whatagraph
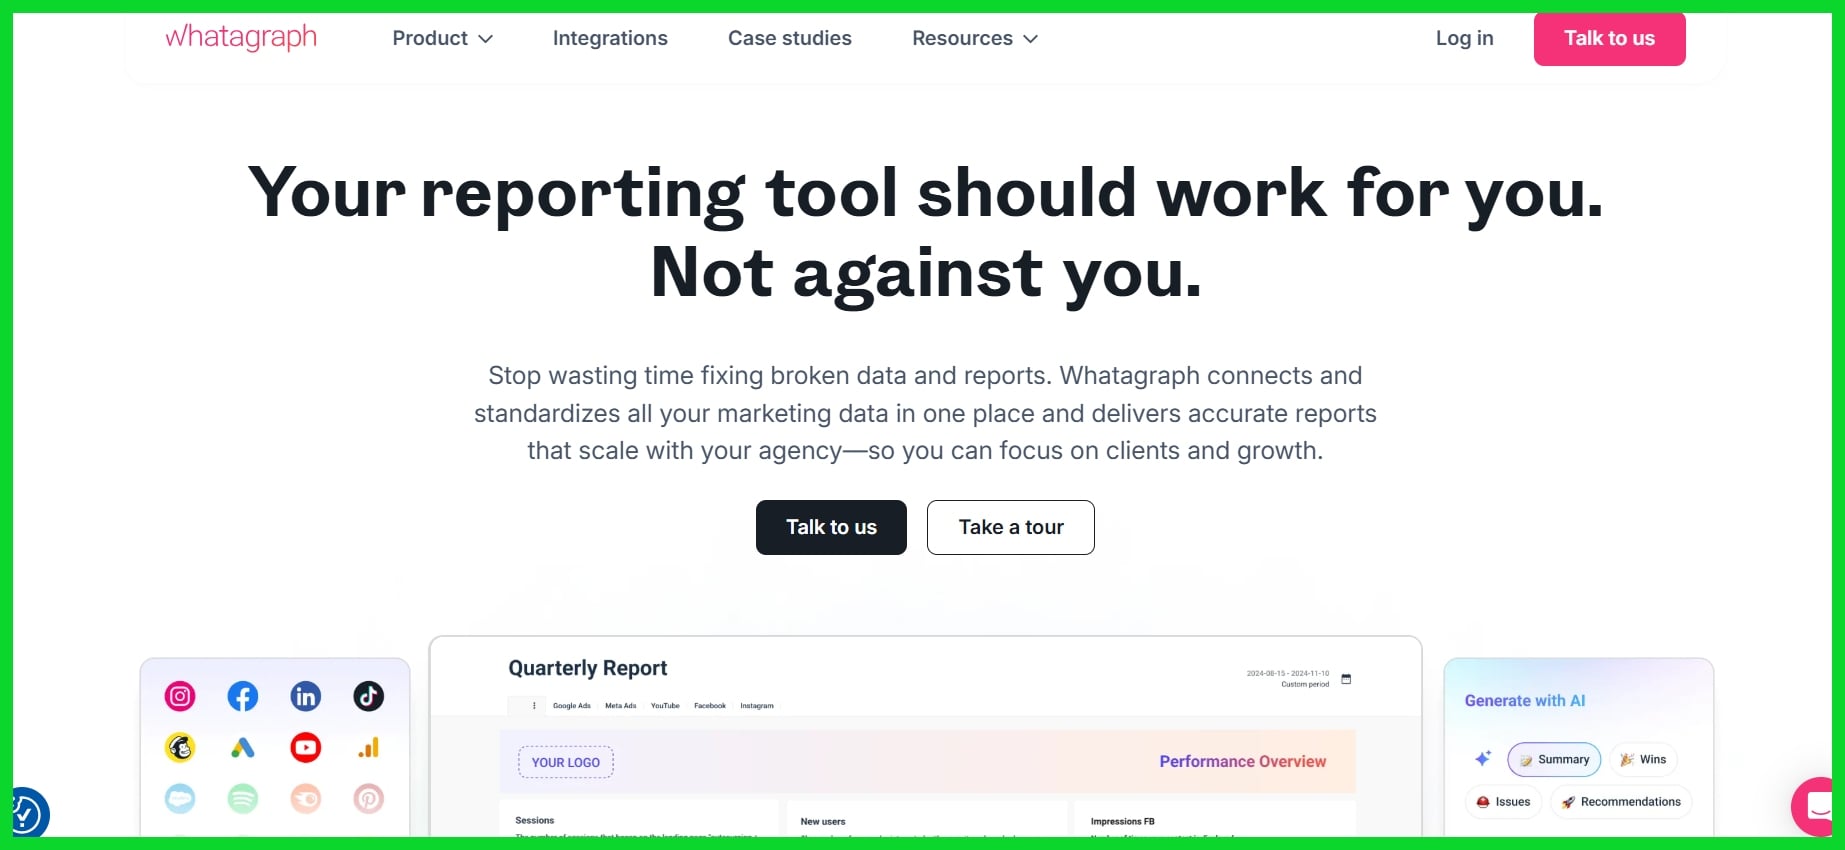
Key Features: Drag-and-drop dashboard builder, cross-channel integrations, automated scheduled reports, white-label support, and GDPR-compliant.
Whatagraph is a favorite among agencies that prioritize beautiful visuals and client-ready reports. It’s highly intuitive, supports a wide variety of integrations, and automates most of the manual work with scheduled reporting. However, the pricing can be steep for small agencies or freelancers, and some users have reported occasional glitches or bugs when dealing with large datasets or niche data sources.
3. Klipfolio
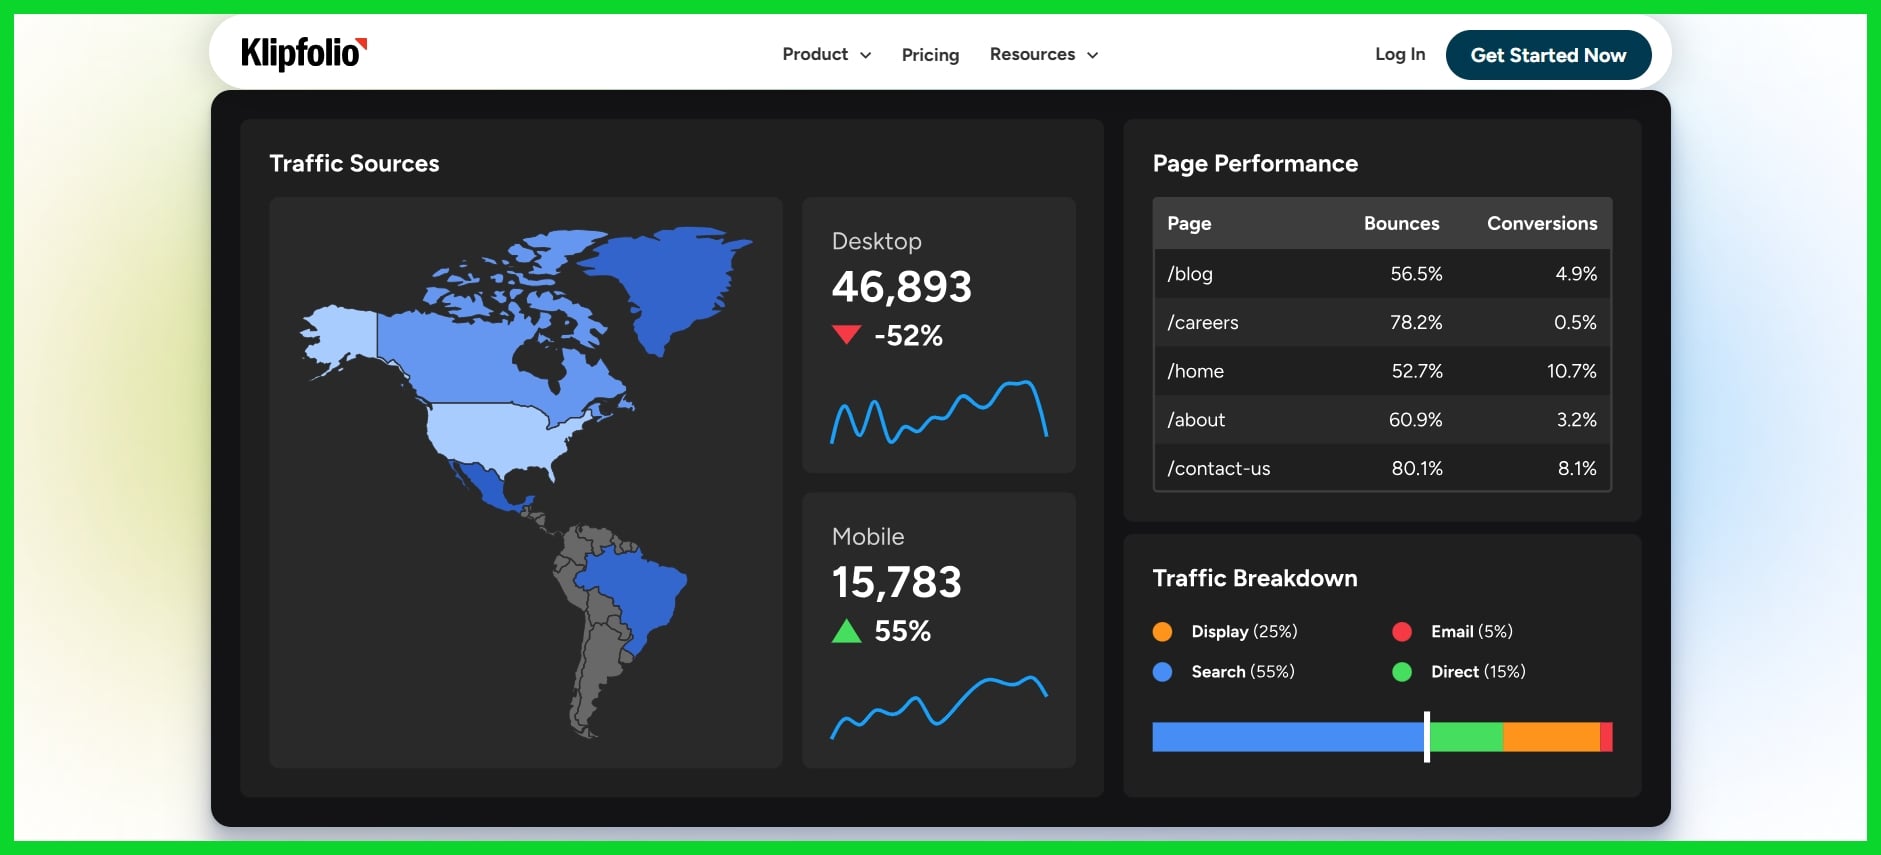
Key Features: 130+ data connectors, formula-based custom widgets, real-time dashboards, HTML/CSS/JS editing, and team collaboration.
Klipfolio is a powerhouse for agencies that require highly customized dashboards and advanced BI capabilities. It’s especially valuable for technical teams who want to build detailed visualizations using raw data and formulas. The trade-off is that it comes with a steeper learning curve and may overwhelm teams without technical experience. It’s also a bit more expensive than other options when scaled up, and performance may lag with complex or heavy datasets.
4. Tableau
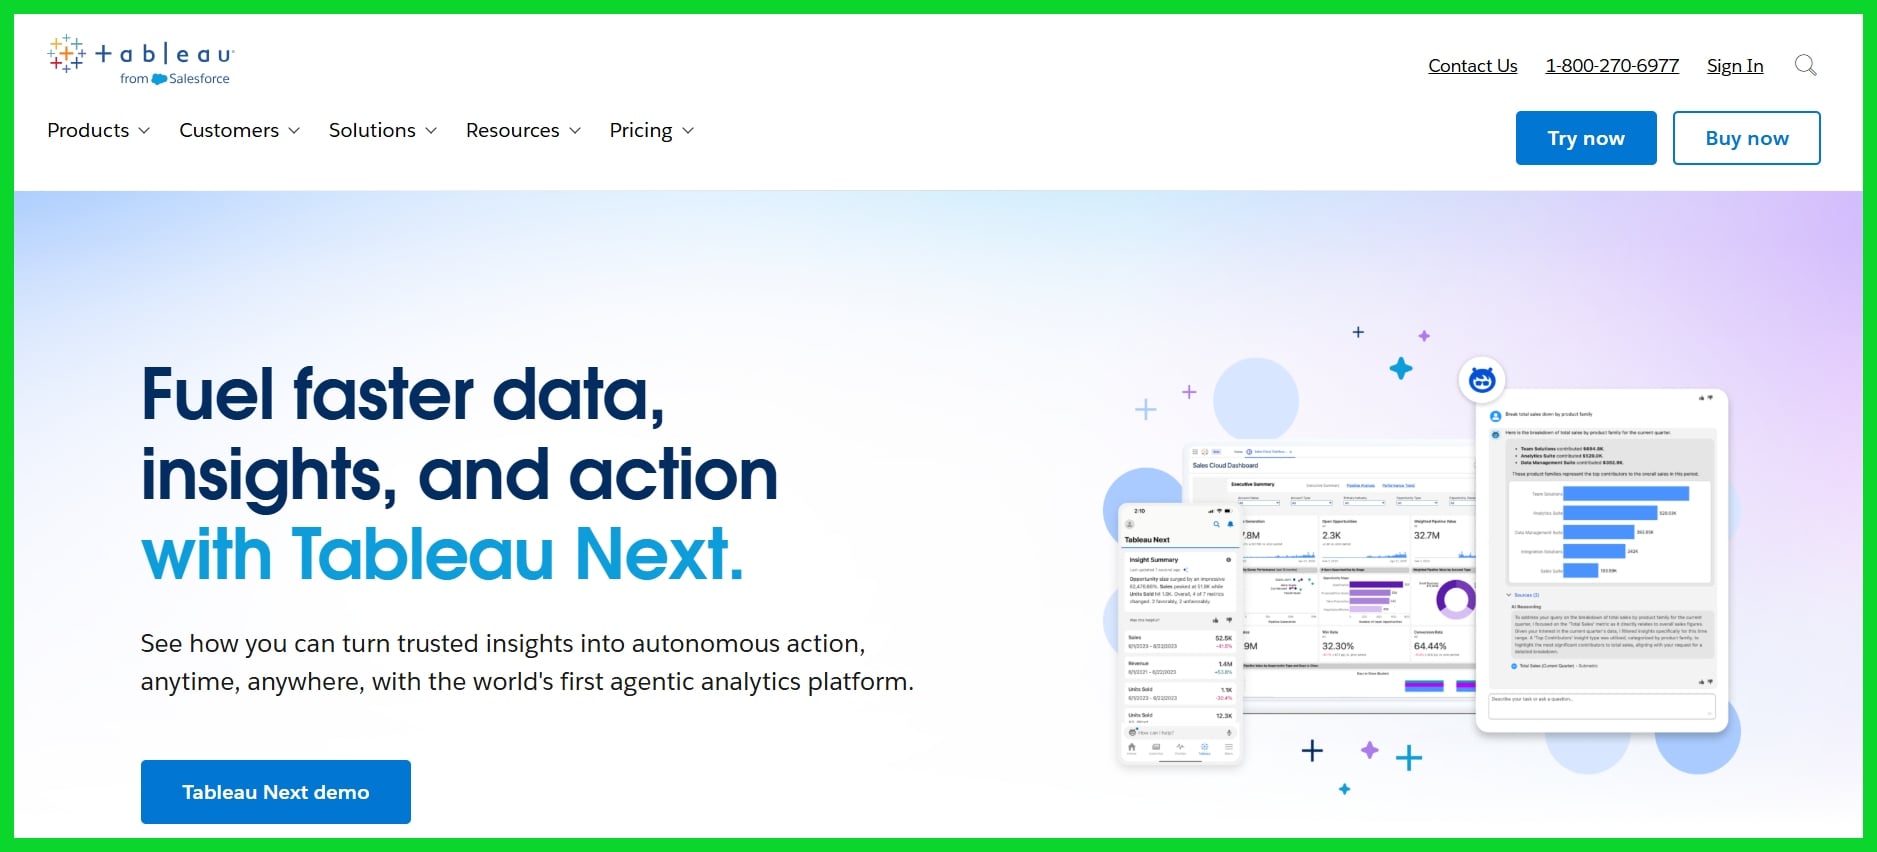
Key Features: Advanced visual analytics, machine learning integrations, real-time data exploration, and massive data capacity.
Tableau offers the most depth in terms of analytics and visualizations, making it ideal for enterprise agencies managing complex datasets and detailed reporting. Its capabilities go far beyond standard dashboards, offering predictive modeling and deep drill-downs. That said, it’s not beginner-friendly. The platform is expensive, hard to implement without technical help, and can be overkill for agencies that just want automated marketing reports.
5. Looker Studio (formerly Google Data Studio)
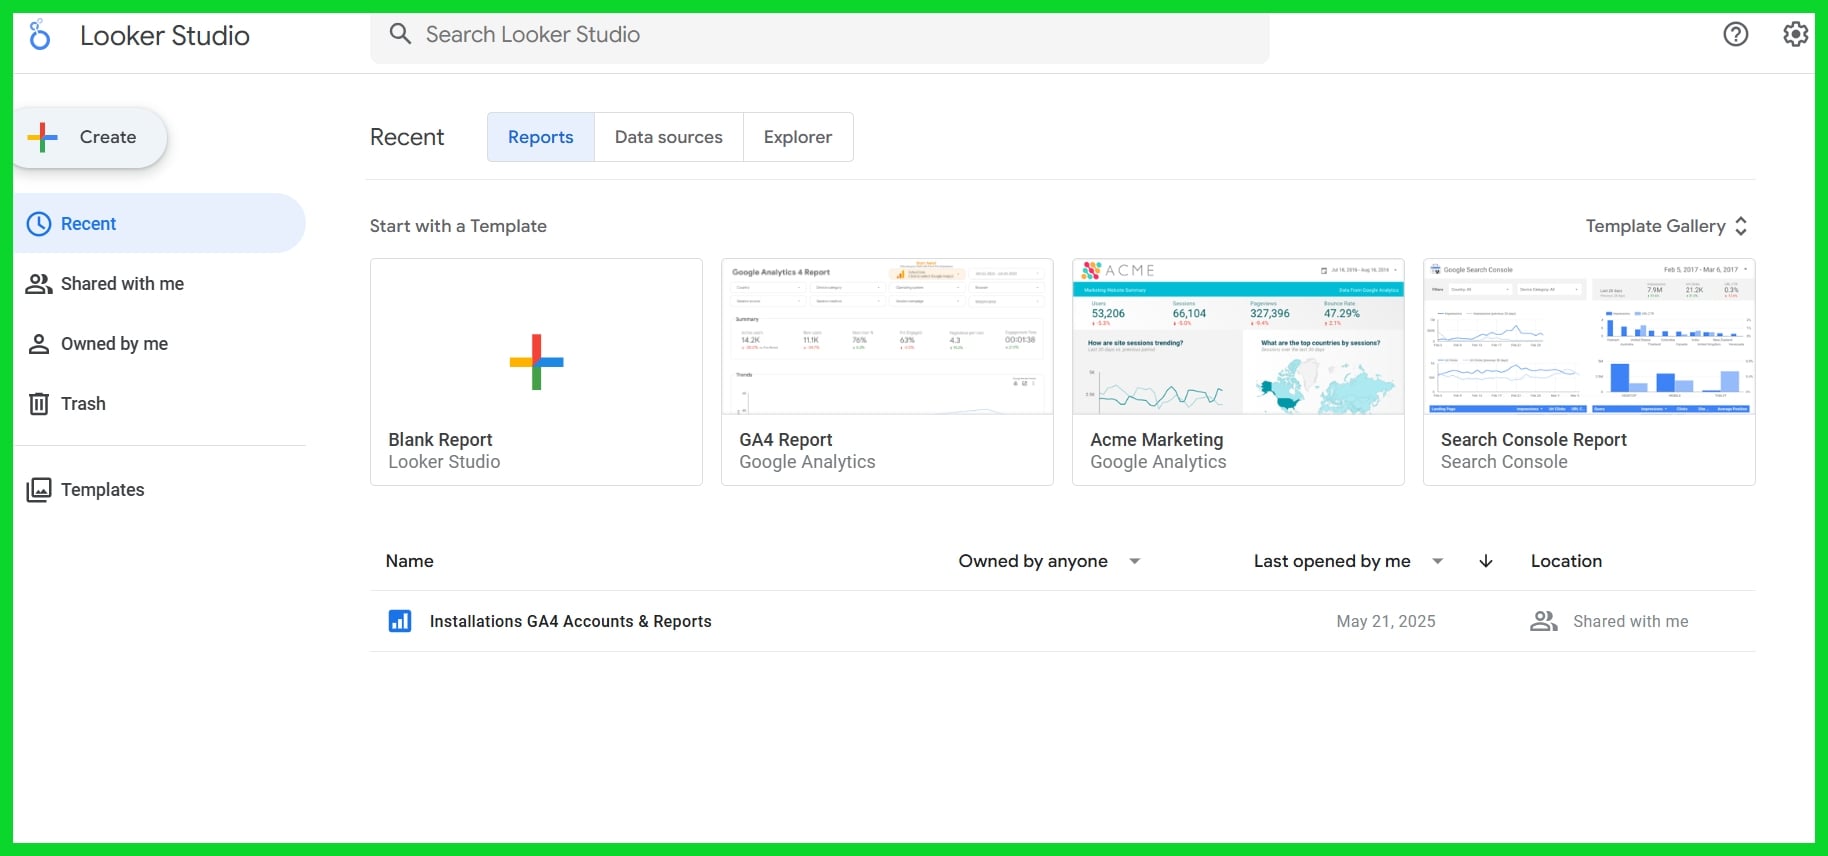
Key Features: Real-time Google integrations, customizable templates, dashboard sharing, and community plugins.
Looker Studio is a go-to option for budget-conscious agencies or freelancers starting out. It’s completely free, integrates perfectly with Google products, and offers decent flexibility for report-building. However, it lacks built-in branding features that agencies often need for clients, and using third-party connectors to pull in non-Google data can quickly become clunky or expensive.
6. Geckoboard
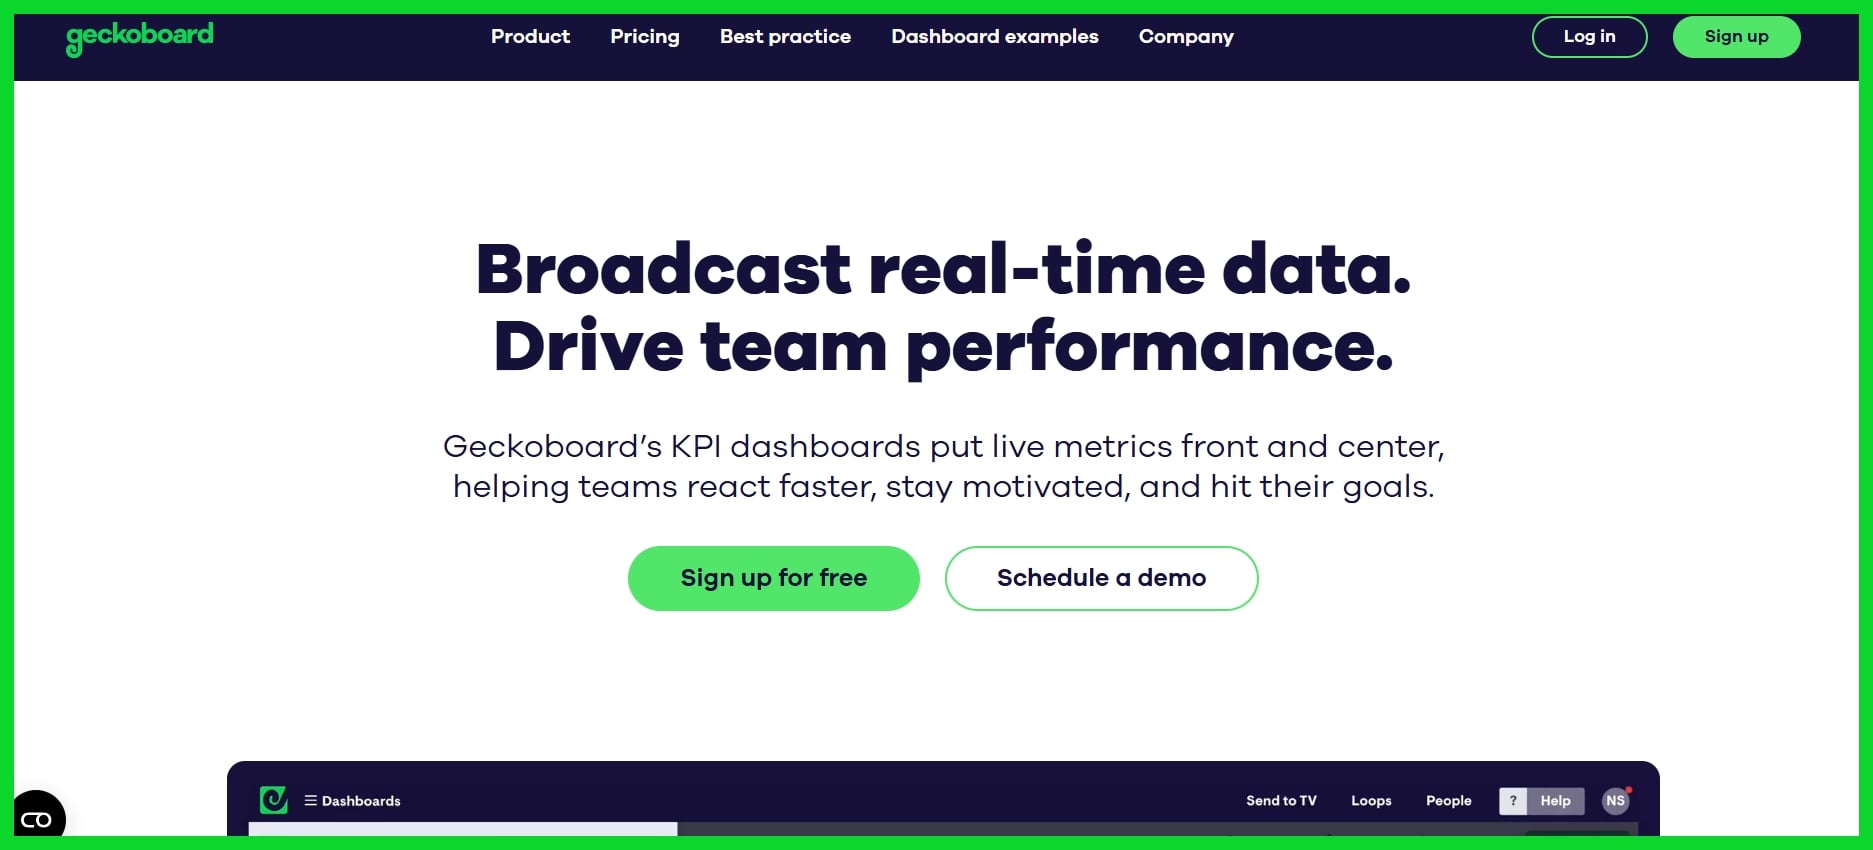
Key Features: Real-time data visualization, display-ready layouts, simple integrations with tools like Zendesk, Google Sheets, and more.
Geckoboard is built for visibility. Agencies often use it to showcase KPIs and team progress on office monitors or internal dashboards. It’s great for team motivation and transparency, but it’s not as strong when it comes to detailed client reporting. The platform can also feel limiting in terms of widget variety and customization, and users have occasionally mentioned UI and UX issues that affect workflow.
7. DashThis
Key Features: Pre-built templates, white-label reports, automated data syncing, and unlimited data sources.
DashThis is perfect for agencies that want ready-to-go reporting with minimal setup. The white-label features and clean designs make reports client-friendly without much effort. However, the simplicity comes at the cost of flexibility. Teams needing complex logic or heavy customization might find DashThis too limiting. It’s a strong visual tool, but it may not be the best fit for advanced data manipulation.
8. Grow
Key Features: ETL capabilities, custom metrics, multi-source blending, real-time insights, and built-in business intelligence.
Grow is a solid choice for agencies looking to combine marketing dashboards with deeper business intelligence. It excels at blending data from multiple sources and delivering strategic insights for both internal teams and clients. That said, it’s not as widely adopted as competitors and may require more setup time to get running smoothly. Smaller teams might also find the interface overwhelming if they’re not familiar with BI workflows.
9. NinjaCat
Key Features: Automated PPC reports, call tracking, client reporting dashboard, campaign insights.
NinjaCat is designed for agencies focused on paid media. It excels in automating Google Ads, Facebook, and call reporting in a way that’s streamlined and easy to share with clients. It’s an all-in-one platform for performance marketers, but it’s also very niche. If you’re not managing PPC accounts or call data, the tool might not provide enough value to justify the cost.
10. Cyfe
Key Features: All-in-one dashboard, marketing and web analytics, affordable pricing, multiple integrations.
Cyfe is a lightweight and affordable tool for agencies that want to monitor a broad range of marketing activities without breaking the bank. It covers most basic use cases and works well for internal tracking or startup clients. However, it lacks many advanced customization options and can feel outdated compared to newer platforms. It’s more of a starter tool than a long-term solution for growing agencies.
Essential Reporting Features
A good reporting feature is more than just number pulling. It enables agencies and consultants to see the larger narrative, demonstrate value to clients, and act quickly on new trends. The right features are everything when juggling multiple clients or crazy campaigns.
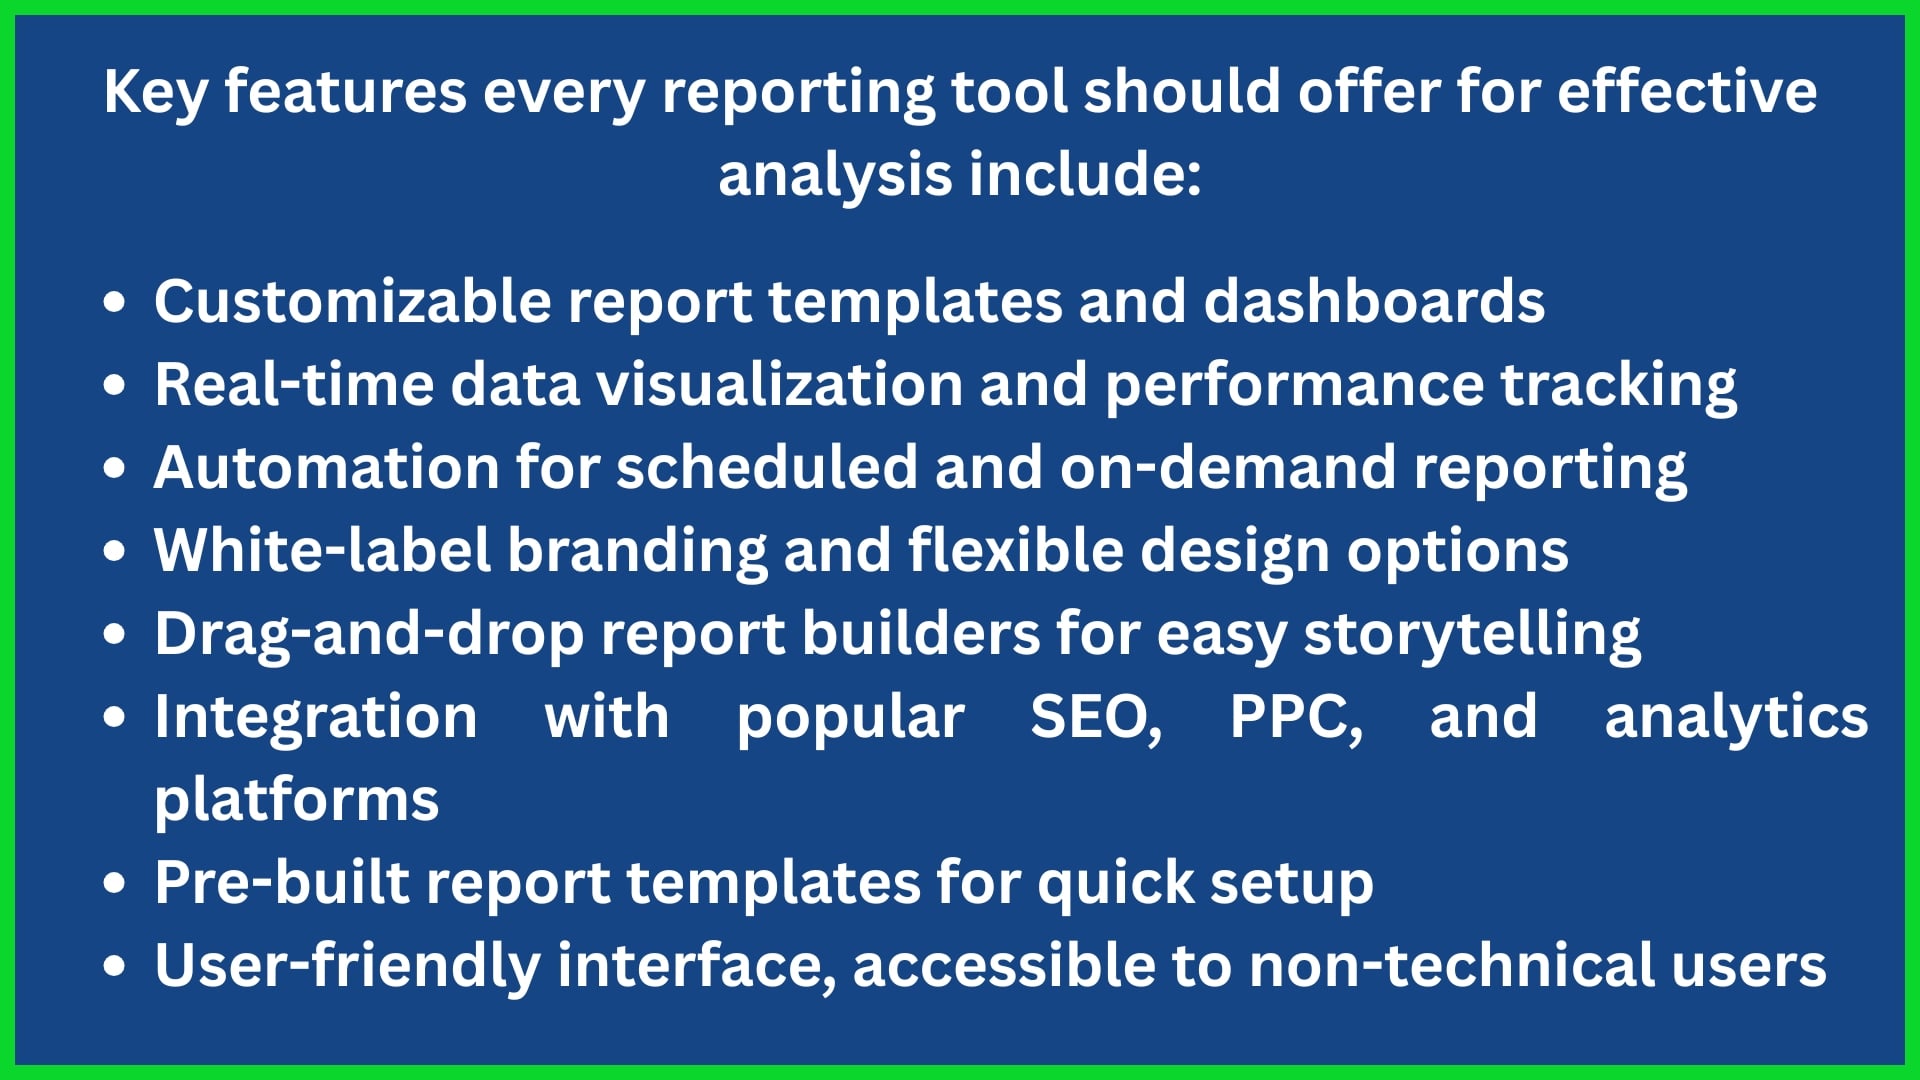
An agile reporting platform flexes to different client demands—be that displaying monthly SEO advancement or monitoring worldwide ad spend. Customizable dashboards allow teams to emphasize what’s most important, and real-time updates assist in identifying trends in real time. This accelerates decision-making and enables agencies to respond before minor issues escalate.
For agencies managing hundreds of accounts, automation is a godsend. They reduce grunt work, so teams can put more hours towards insight and less towards report grunt work. Great reporting features foster client confidence and happiness, too, which helps agencies hold onto clients for longer.
White-Labeling
White-labeling is essential for agencies looking to maintain their branding, especially when using a marketing reporting tool that aligns with their identity. Clients feel more comfortable when reports reflect the same aesthetic as those from the agency they trust, rather than a third-party platform. Custom colors, logos, and branded templates help build that layer of trust.
Many users find that AgencyAnalytics has limitations in this area. The branding options can be restrictive—logos may appear small, color schemes can be inadequate, and URLs might not be fully customizable. Agencies seeking more flexibility often turn to excellent AgencyAnalytics alternatives like DashThis or ReportGarden, which offer enhanced customization for reports.
These alternatives provide comprehensive reporting features, allowing agencies to tailor almost every aspect of the report, from login screens to subdomains, ensuring a more personalized experience for their clients.
Automated Insights
Machine-generated insights save time, especially when time is of the essence. Agencies can configure scheduled reports that dispatch performance snapshots without lifting a finger. Teams don’t waste hours duplicating data or constructing charts — which is a game-changer for marketers managing dozens of clients.
Automation accelerates decision-making. With real-time alerts flagging sudden drops in rankings or ad performance, teams can move quickly. Good reporting features keep data fresh — often syncing every hour or even every few minutes.
Options such as Swydo and Whatagraph shine here, providing sophisticated automation, real-time notifications, and actionable insights based on big data.
Collaboration Tools
Essential reporting features as collaboration features, help your team work better together. Shared notes, comment threads, and task assignment tools keep everyone on the same page. This turbocharges project results and enables agencies to react in real-time to client inquiries or changes.
Certain platforms, such as Whatagraph, have integrated chat and approval flows, streamlining collaboration. Others, like DashThis, allow you to invite clients or teammates directly into your dashboard, so feedback is immediate.
Effective collaboration tools equate to fewer lost messages and more visibility into workflows. They assist agencies in keeping clients satisfied and projects on schedule.
Evaluating Platform Fit
The right analytics tool defines how an agency operates, expands, and retains clients. The right fit speeds teams, clarifies reports, and delivers to clients the insights they crave. It’s not simply the one with the most features. It’s about finding the right fit for your agency, your work style, and your objectives.
Be sure you evaluate platform fit as well — see if it’s intuitive, fast to implement, and allows you to customize dashboards for each client. Drag-and-drop widgets, robust data security, and sophisticated methods to blend and filter data all count. Even the most amazing tool isn’t worth much if it won’t scale, fit into your workflow, or keep up with growth.
Scalability
Scalability refers to a platform’s ability to grow with your agency — not work against it. If you begin with a handful of clients, will your reporting tool keep pace when you manage dozens? For many agencies, their first analytics tool is quickly outgrown, as it can’t process bigger data loads or more users.
Others, such as DashThis and Whatagraph, allow you to add additional clients or users without large increases in either cost or complexity. Flexible plans are important. Seek out tools that allow you to scale up or down the number of dashboards, users, or reports.
Choose a tool that won’t make you change platforms when your agency scores a big client or takes on a new service. If your tool can’t keep up, you spend more time doing grunt work and less time delivering insights.
Integration Quality
A platform’s value reveals itself in how much it can integrate data across all your channels. The top options connect with Google Analytics, Facebook, LinkedIn, and even more niche tools. That means you view it all together, without importing spreadsheets and emailing consolidated files.
Powerful integrations allow you to configure custom metrics, combine data, and monitor real-time statistics. They reduce mistakes. If data comes in clean, your reports stay sharp and trustworthy. Solutions such as Databox and Klipfolio provide deep integrations with multiple services—dozens in each case—ensuring your marketing data remains dependable.
Support and Training
- Fast, helpful support means less downtime and smoother onboarding.
- Training helps teams use every feature, raising adoption rates.
- Good documentation speeds up learning for new hires.
- Agencies sidestep missed deadlines when they receive assistance at the moment they need it.
Tools such as Swydo are excellent agency analytics alternatives for live chat, onboarding sessions, and transparent guides. Responsive support means agency analytics users solve problems faster, keeping clients happy and teams humming — no long waits or confusion.
The Rise of KPI-Centric Tools
Marketing agencies and consultants are now confronted with a world where decision-making based on data is crucial. KPI-centric tools, such as agency analytics alternatives, are front and center, as agencies must keep pace with rapid changes and real-time input. These platforms allow teams to monitor KPIs and identify trends from various sources collectively, enhancing their marketing analytics capabilities.
For mid to large agencies, KPI-centric tools signify that all the data is in one place, not spread around everywhere. You get dashboards that reveal what’s working, what’s not, and where to look next — making the job less of a guessing game and more of an exercise in clear action. Custom options, including templates and widgets, help teams construct screens that fit their objectives, making them excellent agency analytics alternatives.
Still, others do find these tools tricky initially, requiring additional time or expertise to configure them properly. Data accuracy and customer support are hit or miss, but the drive for real-time, reliable insight has kept these tools on their growth trajectory, offering comprehensive reporting for marketing teams.
Focus on Goals
Agencies and marketers are aware that following every metric can cloud the system. When you focus on a specific objective, such as boosting organic traffic or reducing cost per lead, all the reporting begins to become more structured.
Goal-centric reporting provides teams with a roadmap. Rather than getting drowned in numbers, you can see how small changes shift the needle on what matters most. Other options, such as DashThis and Whatagraph, differentiate themselves by incorporating goal tracking into their reporting.
They provide widgets that display progress towards every campaign goal, so the team is able to get wins and losses at a glance. It makes agency performance easier to measure and explain. It’s not only smart, it’s what Mark calls the ‘rise of KPI-centric tools’, which he says will define the next generation of agency software.
Simplified Views
Simple, clear dashboards help everyone see what’s happening faster. When data is easy to consume, clients will comprehend and trust it.
Visuals such as charts and graphs transform rows of numbers into narratives that folks can track. Tools such as Swydo and ReportGarden are noted for user-friendly dashboards and clean layouts. These allow agencies to deliver reports that even the non-technical client can easily understand.
Abbreviated views maintain client interest. They reduce ping-ping-ping and engender confidence with transparent, straightforward status reports.
Actionable Data
KPI-centric tools shine brightest when they convert digits into directions. Agencies want to know not just what happened, but what to do now.
Platforms such as Klipfolio and Databox are designed to emphasize actionable insights. They flag when a KPI dips or spikes and can even suggest why. This allows teams to move quickly, adjust campaigns, and witness impact earlier.
Trend or shift call-out reports help agencies demonstrate their worth. They give clients insight into more than just what’s being measured, but how strategies are performing—real-time.
Making Your Final Choice
Choosing the right marketing analytics tool for your agency is more than just opting for what looks appealing or what’s most popular. Each agency has its priorities, objectives, and working styles. Some teams are data-hungry and want every metric monitored, while others prefer basic client reports that they can hand over directly.
The trick is to align what a tool excels at with what your agency most requires. This task isn’t always easy and can become stressful—especially when you have multiple agency analytics alternatives in front of you. We’ve all been there—comparing options, checking out reviews, polling the team, and still feeling uncertain about which direction to head. That’s completely natural.
The point is, don’t rush in or get mired in perpetual research. Before you select, ensure your choice aligns with your agency’s daily work and strategic objectives. As Noah Kagan wisely advises, it’s clever to consider the positives and negatives of each option — along with the slick sales pages.
Some folks prefer to trust their gut, but even then, it’s beneficial to lay out the facts and consider elements like agency analytics pricing, ease of use, and what features truly matter. For others, discussing it with a partner or team can provide fresh perspectives and reveal potential blind spots. Avoid getting stuck in analysis paralysis.
All the data in the world might still not clarify the decision, and delaying too long means missing out on a resource that could help your agency scale today.
A considered decision now can reward you for years, providing your firm dependable information, streamlining effort, and aiding in demonstrating worth to customers. Each agency is different, and therefore the optimal analytics tool is the one that suits you—not the one with the most features or the most glitzy design.
Conclusion
Discovering the right analytics tool is a little like selecting a nice pair of sneakers. You desire the fit, the appearance, and the quickness. Some people want deep reports, others are more interested in cost or pretty charts. A lot of tools will now allow you to monitor key metrics, distribute quick updates, and establish well-defined objectives. A tiny team of hyper-focused experts in Berlin discovered the missing new tool last year — cut out the extra steps and doubled their client wins.
Choosing the right match requires trying a few, reading independent reviews, and consulting with your staff about what counts. To rack up more victories for your agency, give one of these new tools a whirl. Dive in and find what works best for your audience.
Frequently Asked Questions
What are common reasons to look for alternatives to Agency Analytics?
They might be looking for excellent agency analytics alternatives due to factors like pricing, integrations, and customizable reporting. Some marketing agencies need platforms that scale with their growth or provide more robust customer support.
Which features should I prioritize when choosing an analytics platform?
Prioritize simple data import, customizable reporting tools, multi-source tracking, automated notifications, and robust visualization. These excellent agency analytics alternatives assist agencies in saving time and providing transparent insights to customers.
Are there cost-effective alternatives to Agency Analytics?
Sure, many analytics tools have competitive pricing or flexible plans. Certain agency analytics alternatives offer free trials or freemium options, allowing marketing agencies to try out features before subscribing.
How do KPI-centric tools benefit agencies?
KPI-centric tools enable marketing agencies to keep performance goals top-of-mind in real time. By utilizing automated reporting and customizable reporting tools, they eliminate guesswork by surfacing critical metrics, making it simple to optimize campaigns and demonstrate results to clients.
Can I migrate existing data to a new analytics platform?
Nearly all leading analytics platforms, including excellent agency analytics alternatives, provide data import functionality or migration services. This guarantees a seamless switch, so digital marketing agencies don’t leave precious historical data behind when hopping platforms.
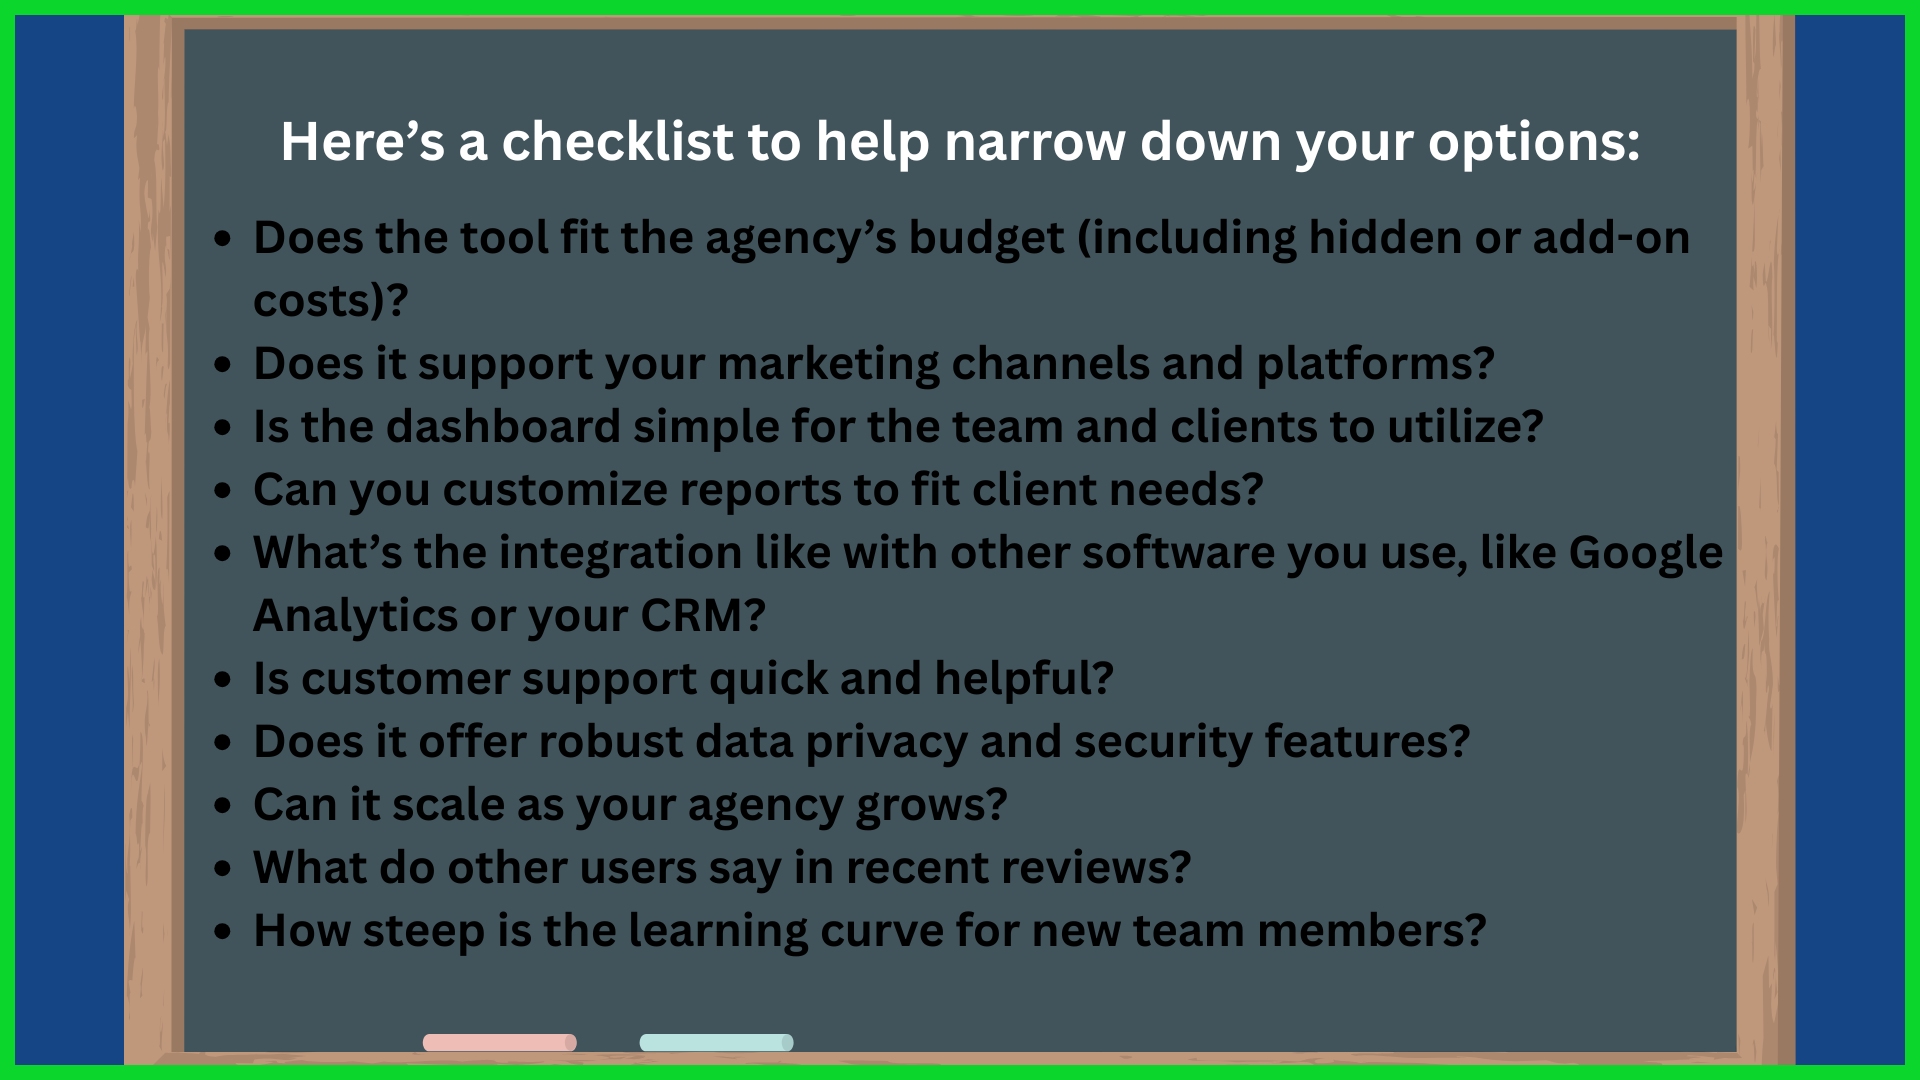
How can I evaluate if a reporting tool fits my agency’s needs?
When evaluating agency analytics alternatives, consider essential features, usability, integrations, scalability, and support. Reading user reviews and requesting demos can help you determine if the marketing analytics tool fits your workflow.
Do analytics alternatives support global clients and multiple languages?
Most leading analytics platforms, including excellent agency analytics alternatives, are multilingual and can easily absorb global data, enabling marketing agencies to support global clients and deliver insights in different markets.