Key Takeaways
- By focusing on key Facebook ad metrics like Return on Ad Spend, Cost Per Result, and Conversion Rate, you’ll know how your campaigns perform and what to do to improve them.
- By consistently tracking and analyzing these metrics, you will be able to make data-driven decisions that deliver better results and a more impressive return on investment.
- Metrics like CTR, frequency, and landing page views show you how your audience is responding to your ads and help you identify areas for improvement.
- Combining hard numbers with audience sentiment and ad fatigue paints a more complete view of your campaign’s effectiveness.
- By aligning your selected metrics to specific marketing objectives, your work remains focused and quantifiable whether you’re cultivating awareness, generating leads, or driving sales.
- If you regularly test ad creatives, audience segments and offers, you can always be driving up your results and keeping your Facebook ad strategy fresh and effective.
Good Facebook ad metrics include click-through rate, cost per click, conversion rate, and return on ad spend. These measures help gauge effectiveness.
Metrics such as these indicate whether people show any interest, click, or purchase after being exposed to an ad. For anyone running ads or reporting results for clients, these numbers help identify victories and repair vulnerabilities.
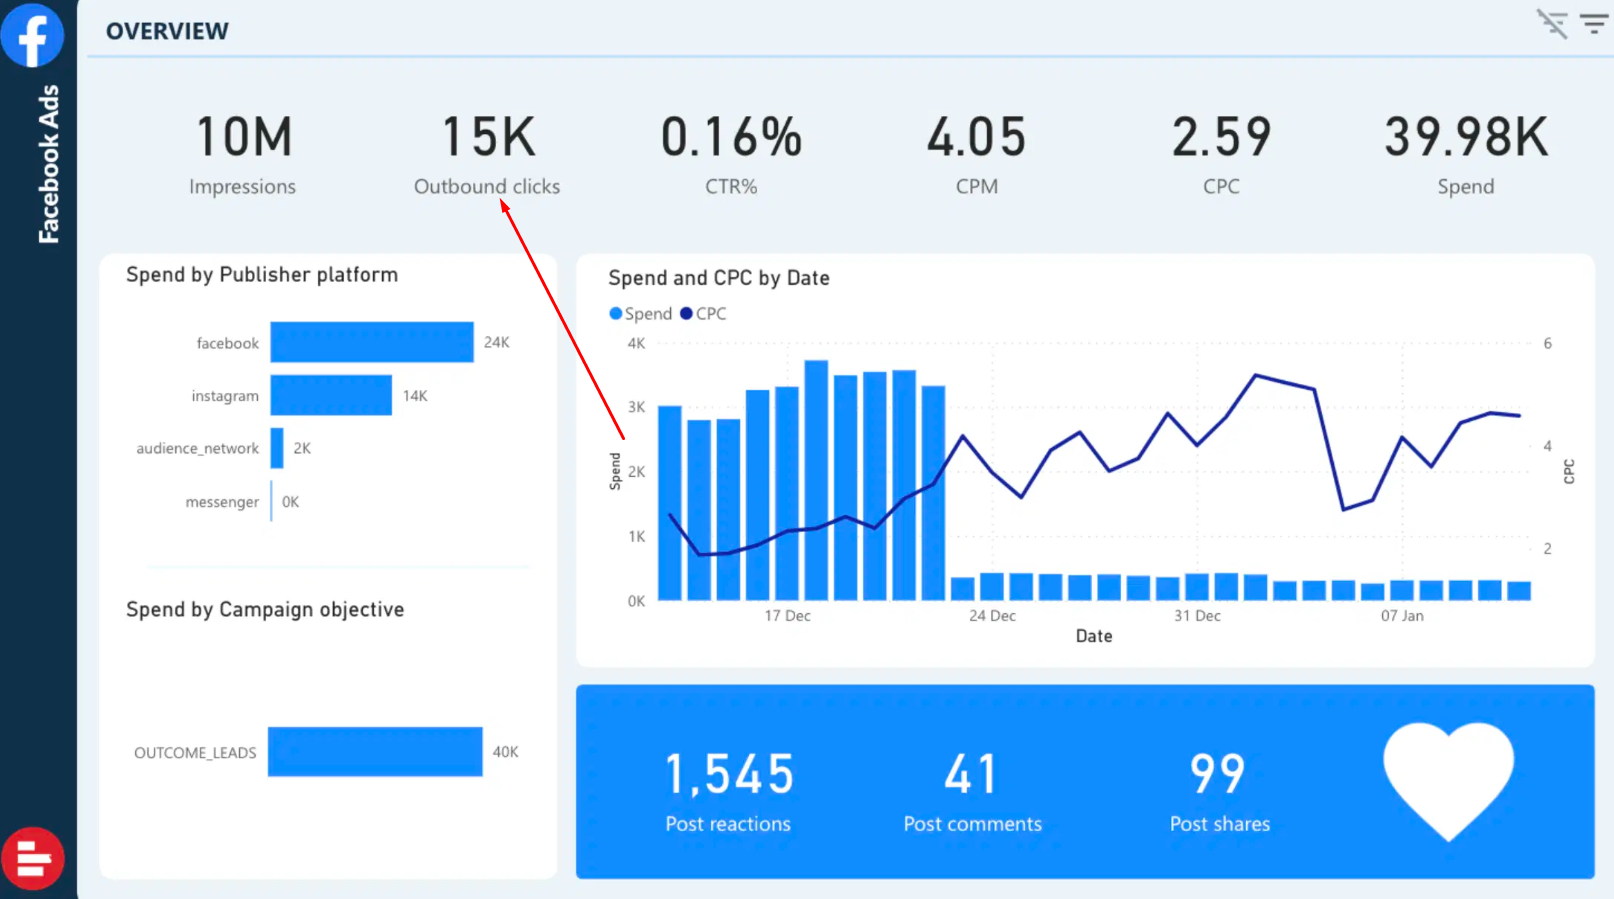
The 11 Essential Facebook Ad Metrics
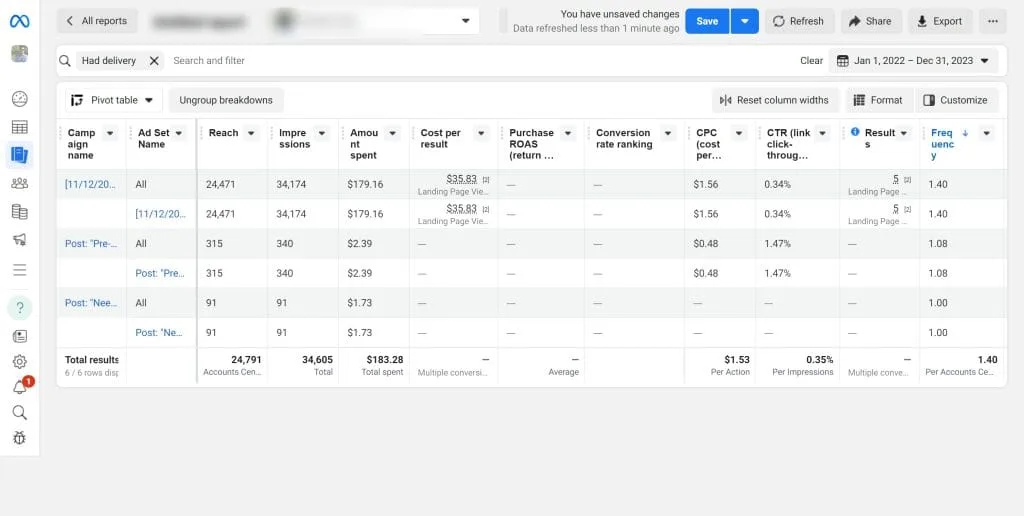
Measuring Facebook ad performance is more than just tallying likes or views. While they’re fun to geek out over, the real value for SEO agencies and digital marketers is tracking the right metrics that affect performance and ROI. Facebook provides a wide range of analytics, but these eleven metrics are the backbone of campaign optimization:
- Return on Ad Spend (ROAS)
- Cost Per Result
- Conversion Rate
- Click-Through Rate (CTR)
- Cost Per Mille (CPM)
- Frequency
- Outbound Clicks
- Landing Page Views
- Video Play Metrics
- Post Engagement
- Media Efficiency Ratio
Checking these metrics on a regular basis enables marketers to make sense of their strategies’ effectiveness. Attribution windows, click-through or view-through, factor into interpreting these data points.
With metrics broken down by categories such as Performance, Budget, Bidding, Audience, Ad Creative and Placement, marketers can take informed action to improve results.
1. Return on Ad Spend
ROAS tells you how much revenue every ad dollar earns. For instance, a ROAS of 4 indicates that for every dollar invested, it generates four dollars in return. Establish ROAS benchmarks for your vertical.
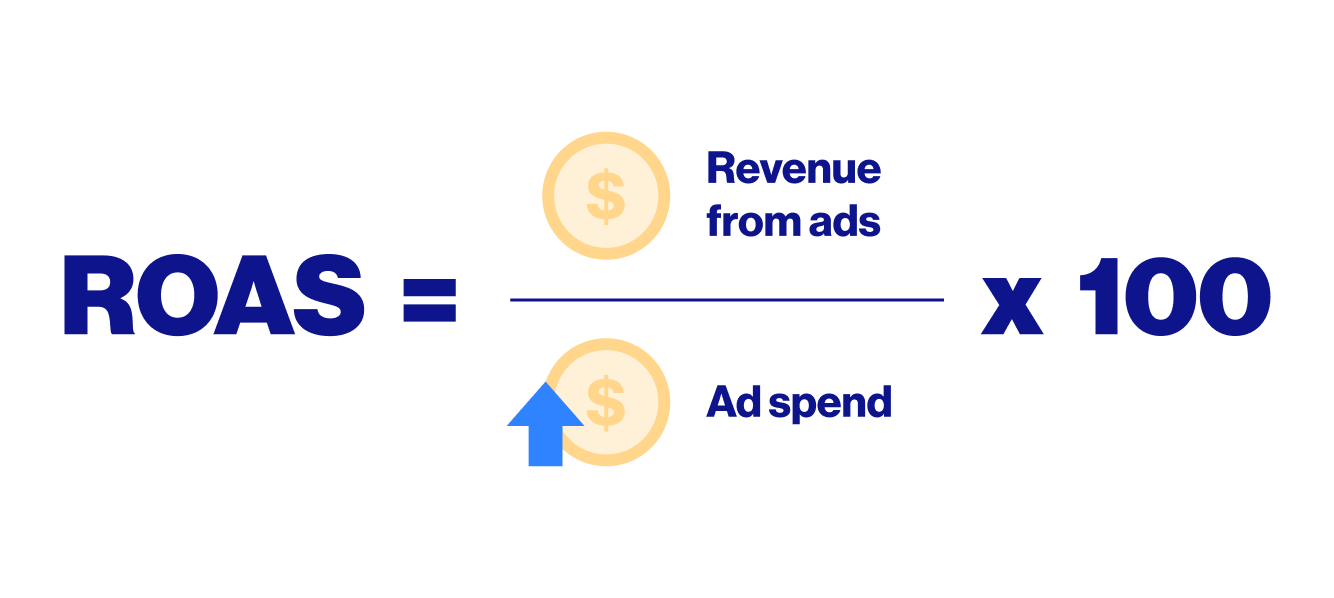
If your ROAS dips, adjust your creative or targeting to trim waste. Track ROAS regularly to keep campaigns in line with business goals and shift budgets to best performers.
2. Cost Per Result
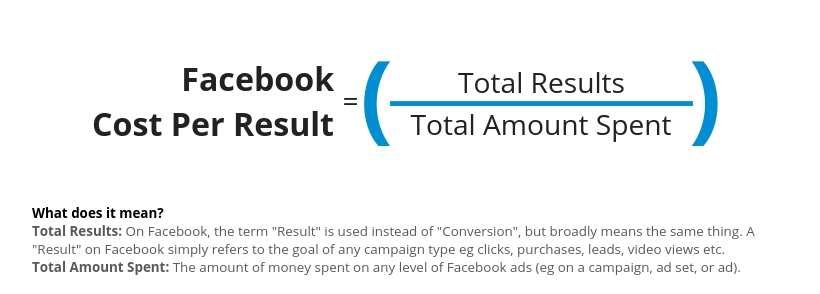
Cost Per Result tells you what you pay for each conversion. Tie this metric back to your budget per campaign. If an ad is less per conversion, funnel more money into it.
Compare Cost Per Result across campaigns to find winners and losers, then reallocate spend where it works best.
3. Conversion Rate
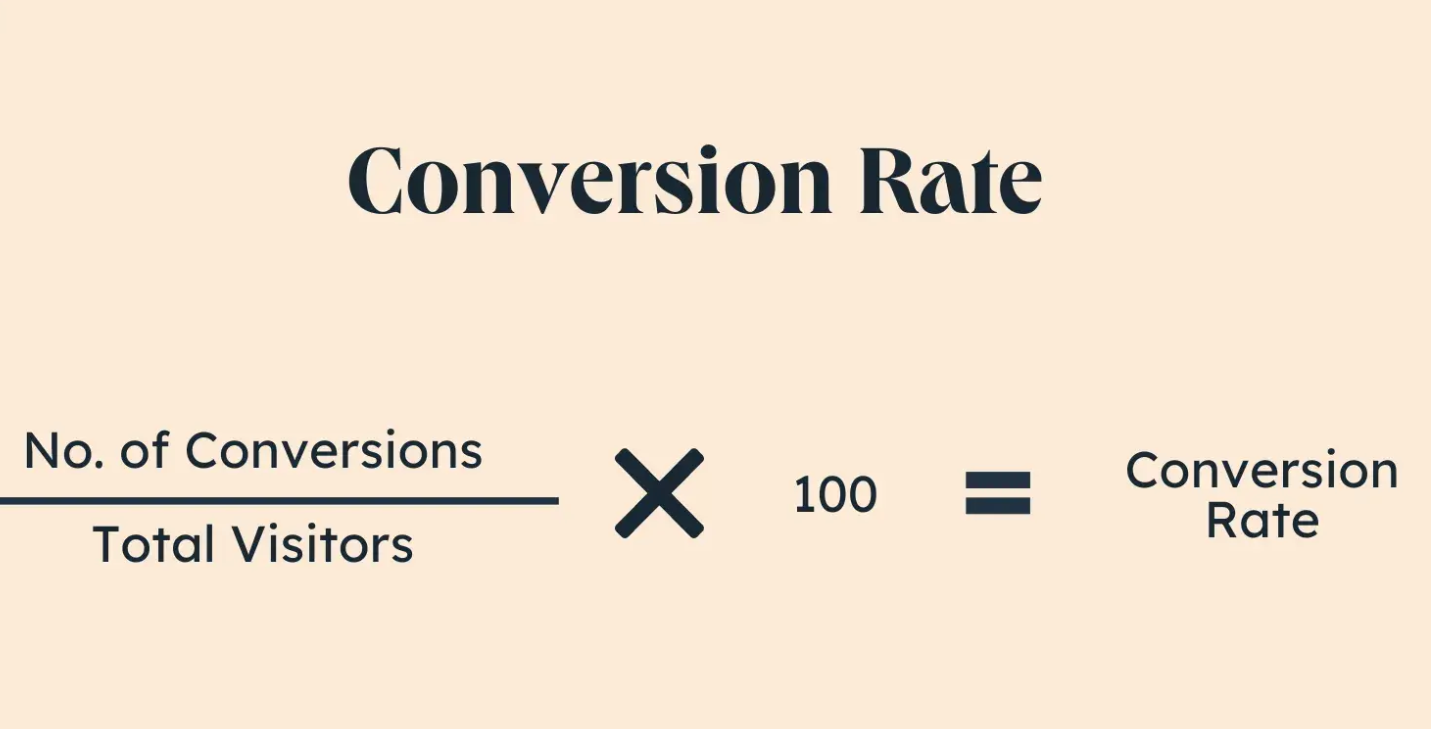
Conversion Rate measures the number of clicks that convert into real actions, such as purchases or registrations. Compare your rate to industry averages to see if you’re leading or falling behind.
If it’s low, switch up the landing page or ad copy. Use this information to optimize your targeting.
4. Click-Through Rate
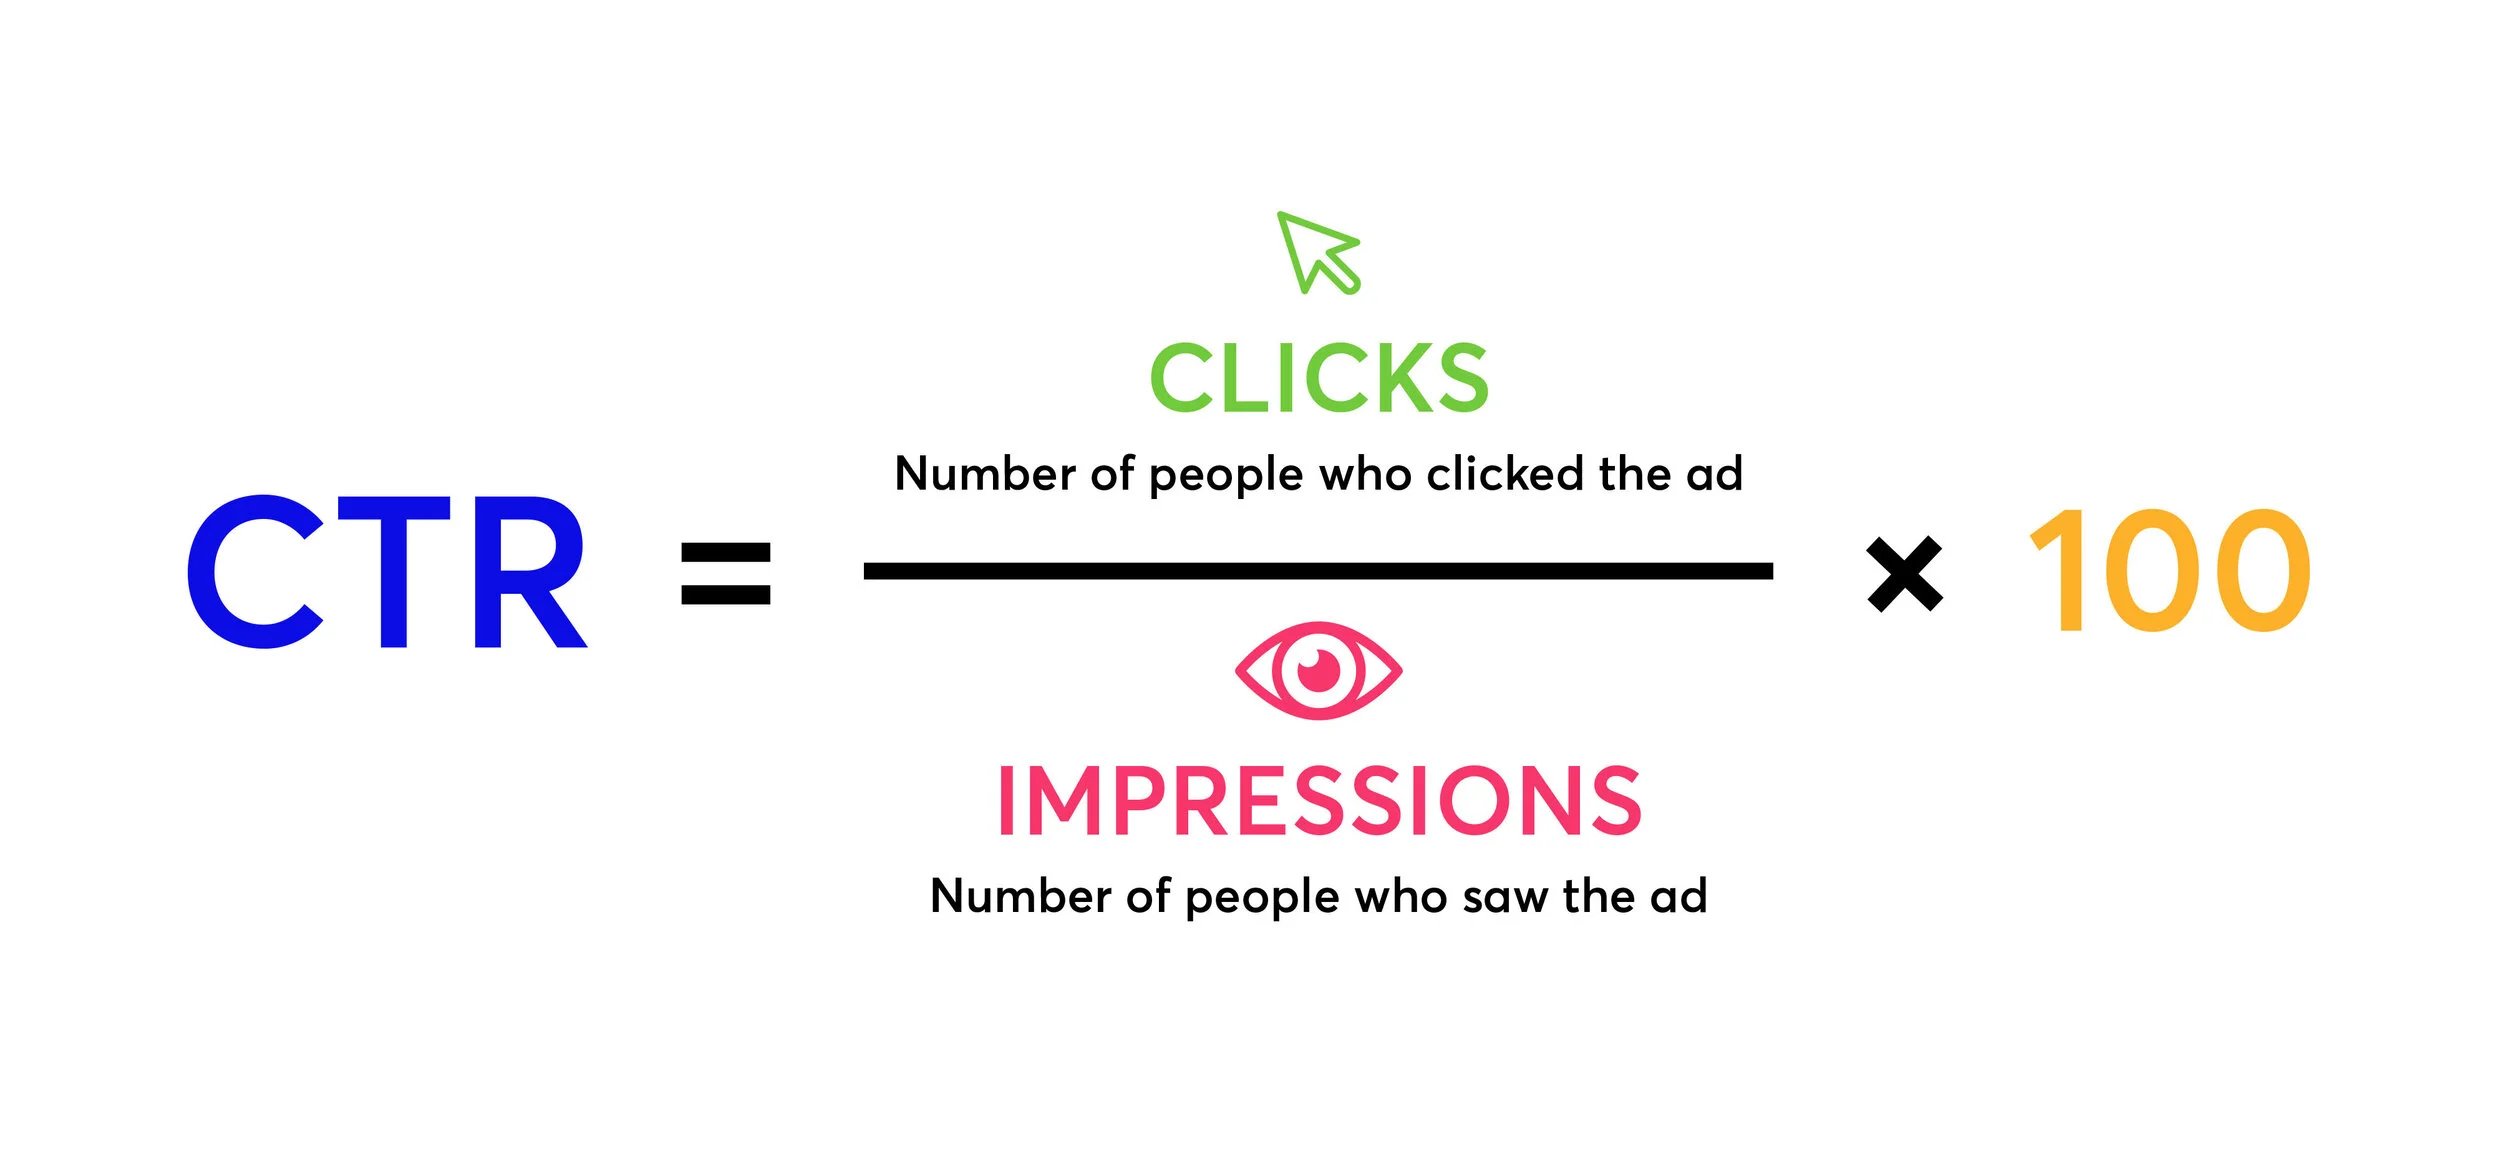
CTR indicates whether your audience is interested in your ad. Compare it to industry averages to see if you differentiate. Experiment with fresh headlines, images or calls to action if your CTR sputters.
Observe how CTR evolves to hone your creative direction.
5. Cost Per Mille
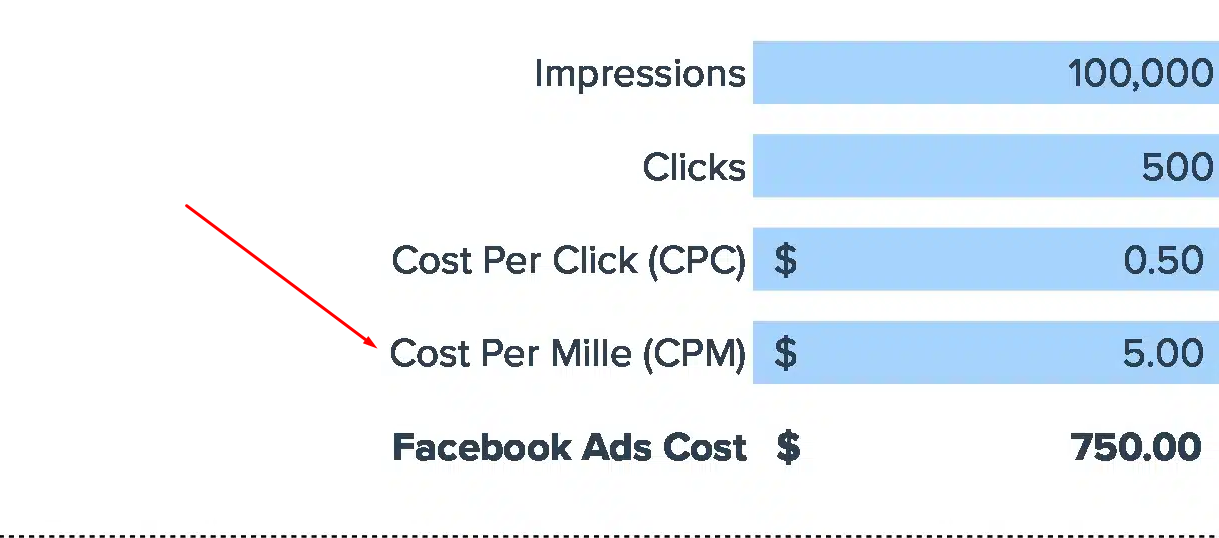
CPM is the cost to reach 1,000 users. Use it to compare various placements such as feed, stories, or sidebar. If CPM spikes, experiment with bids or placements.
Plan where to put your budget for the best reach using CPM trends.
6. Frequency
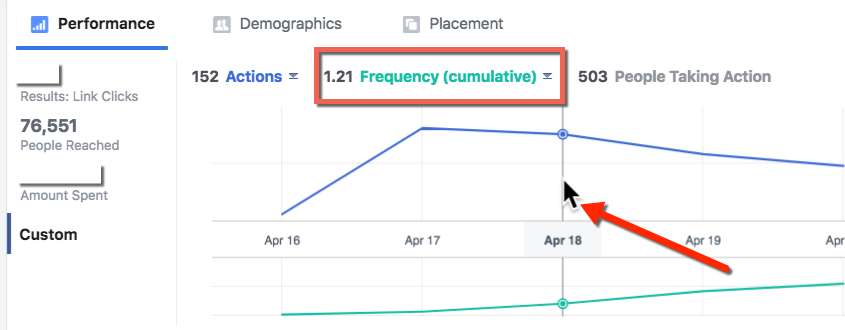
Frequency measures how many times a person views your advertisement. High frequency can lead to ad fatigue, so look out for declining engagement as frequency increases.
Discover the magic time frame where your message is new but not irritating. Impose caps to maintain exposure in balance.
7. Outbound Clicks
Outbound Clicks tell you whether users are interested in your site or offer. Monitor which ads receive the most clicks to determine what’s effective.
If clicks fall, test new calls-to-action or creatives. Track shifts in clicks to assist you in redefining your next target.
8. Landing Page Views
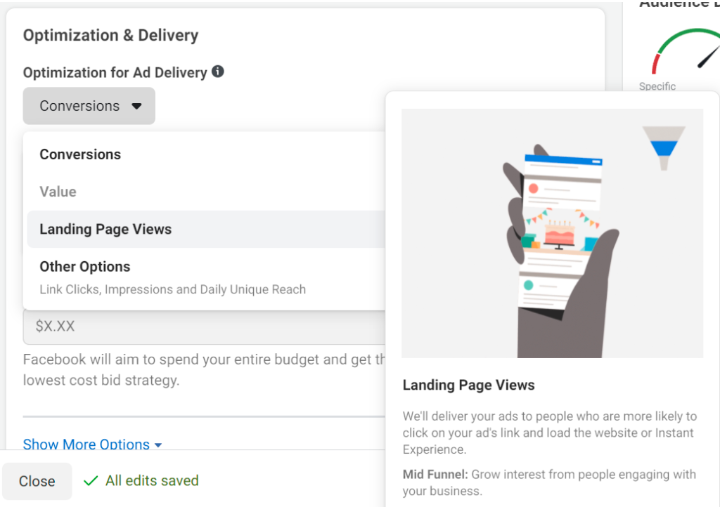
Landing Page Views indicate if users indeed wait to load your landing page. Compare these with Outbound Clicks to identify drop-offs.
If views are low, optimize page speed or design. More views mean more opportunities for conversions.
9. Video Play Metrics
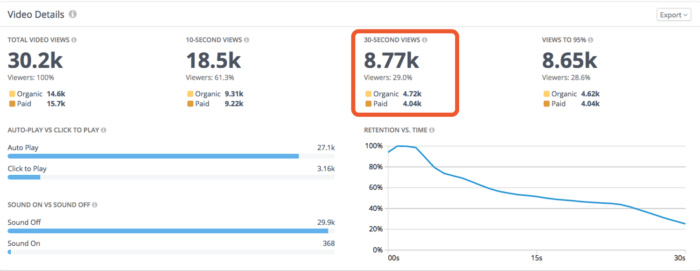
Monitor video insights such as watch time and completion rate. High completion indicates your video retains attention.
Use this information to experiment with shorter or longer videos or new creative angles. Retarget if some groups watch more.
10. Post Engagement
Post engagement includes likes, shares, and comments. High engagement indicates powerful brand awareness and affinity.
If engagement dips, update your copy or images. Turn these trends into future content strategies.
11. Media Efficiency Ratio

This is revenue against media spend. Use it to evaluate which channels convert the best.
If that ratio drops, move spend or test fresh platforms. Track this figure to keep your media plan keen.
Beyond the Numbers
Metrics can reveal trends and hard facts. They seldom convey the entire narrative behind Facebook ad success. Great campaigns go beyond the shallow-connect numbers. They mix the math with bona-fide feedback, audience responses, and other special signals that build better ad strategies.
Examining factors such as audience sentiment, ad fatigue, and algorithm impact tells a more complete story than the numbers ever could.
Audience Sentiment
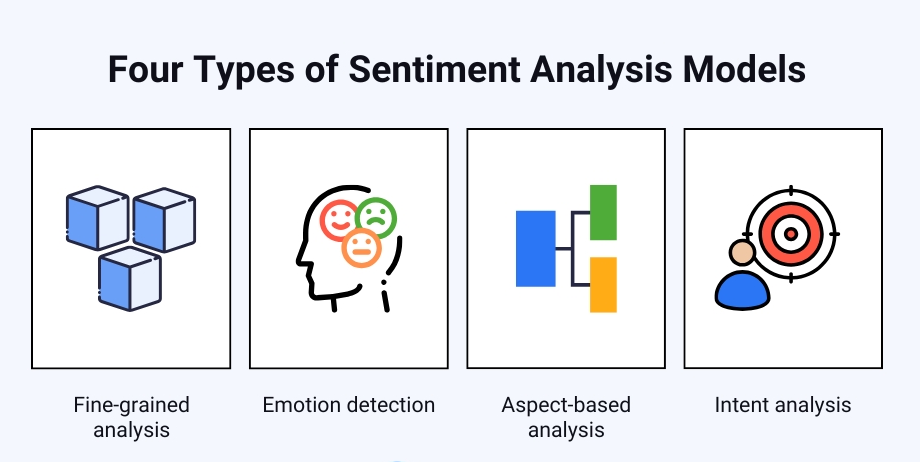
Nothing you can track in a spreadsheet will tell you how people really feel about an ad. Just by reading and sorting comments, you can see if people enjoy, ignore, or even hate your message. Sentiment analysis tools can help identify patterns or consistent feedback and offer insight into what connects or disconnects.
Look at the tone of replies and the language people employ, and you discover insights that numbers can omit. Positive engagement, a share or a thoughtful comment, usually indicates your ad resonates with your audience. Negative reactions, whether it’s critical comments or angry emoji reactions, indicate that it’s time to reimagine your creative or message.
Molding your content around this feedback helps foster trust and keeps your ads relevant. For instance, adjusting your ad’s tone or imagery in response to actual user commentary can convert a tepid reception into a warm one.
Ad Fatigue
Ad fatigue occurs when individuals are exposed to the same creative too frequently, resulting in decreased performance and wasted expenses. This manifests itself as a decrease in CTR or an increase in cost per result. If your ad frequency gets above 4 for News Feed or 8 for Right Sidebar, people are ignoring you.
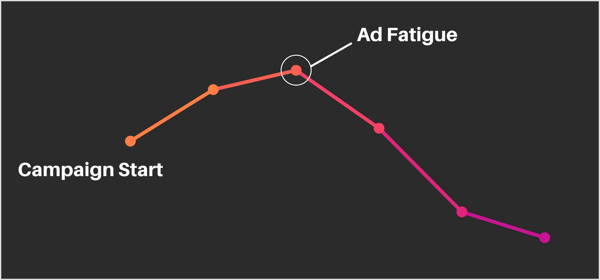
Swap in fresh images, copy, or video styles to keep your ads from feeling repetitive. Tools like Kling AI make it easier to quickly create fresh video variations and test new creative angles without spending extra time or budget on production.
For video ads, make those first 3 to 6 seconds count. Engagement drops like a rock after that. Simple swaps like colors or headlines can keep them from scrolling by.
Align Metrics with Goals
Key is matching what you track with what you want to accomplish. It defines what success looks like, so you know if your Facebook ads are effective. The appropriate KPIs address both helping you identify what to fix and allowing you to make intelligent adjustments along the way.
Different goals require different numbers; not one-size-fits-all. The table below shows which numbers matter for each goal:
|
Campaign Goal |
Main Metrics/KPIs |
Example Benchmark |
|---|---|---|
|
Awareness |
Impressions, Reach, Engagement Rate |
1,000,000+ reach per month |
|
Lead Generation |
Cost Per Lead, Conversion Rate |
€2–€5 per lead, 10%+ conversion |
|
Sales |
ROAS, Cost Per Result, Purchases |
4:1 ROAS, €20 cost per purchase |
Select metrics that align with your objectives. Use these figures to monitor your advancement. Ground your benchmarks in both your own historical numbers and your peers’. Keep in mind that Meta’s default is a 7-day click or 1-day view when attributing counting actions.
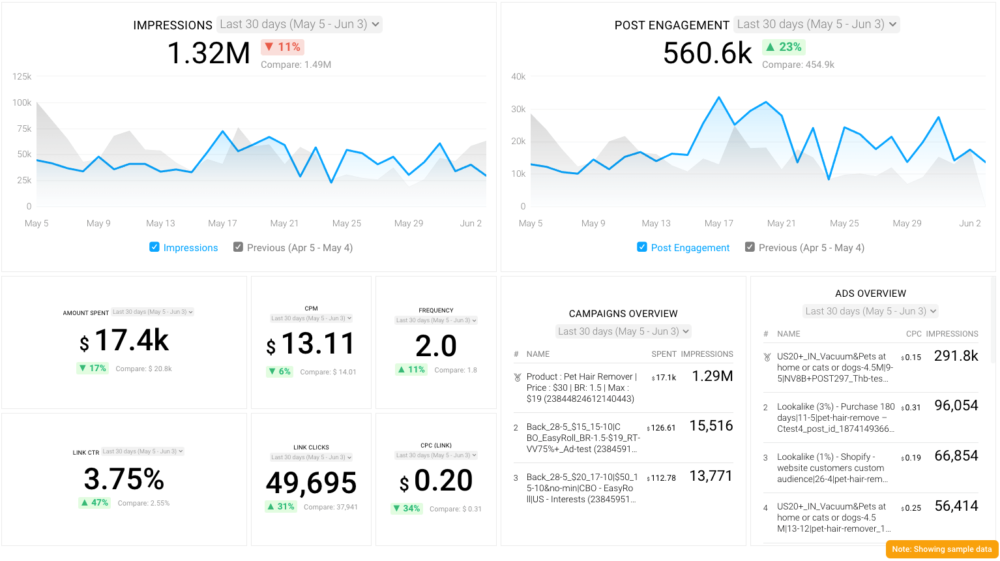
Awareness Campaigns
Impressions and reach indicate how many people viewed your ads. High numbers indicate that your ads are there, but you want more than looking eyes; you want people to care. Engagement rate tells you whether the audience is actually listening or just skimming.
A goal like “increase engagement by 10%” gives you something concrete to work towards. See who’s viewing your ads and what the response is. If a group responds more, narrow your targeting to get more of their ilk.
Measure what pictures or videos receive more shares or comments. It’s not about the latest shiny new metric you can measure; it’s about what is going to advance your goals. Video watch time and completion rates let you know if your message captures attention.
Lead Campaigns
For lead generation ads, it’s crucial to measure important metrics such as how much you pay per lead and the percentage of viewers who register. If your cost per lead increases, it’s time to adjust your offer or call-to-action. Focus on the quality of leads, not just the quantity, as this can significantly impact your conversion rates.
Much of what looks good on paper may not convert effectively. By analyzing performance metrics, you can compare how different audiences react to your ads. This allows you to invest more in successful facebook ads campaigns and less where it isn’t effective.
Simple forms and clear value in your copy can increase sign-ups. If one offer performs significantly better, make it your new baseline. Always track your facebook ads metrics and adjust your goals as you progress.
Sales Campaigns
Look at ROAS to check if your spend pays off. Beware if your budget is low; one big sale can make the ratio terrific when the truth is otherwise. Cost per result and total purchases are more obvious for consistent growth.
Put a number you want to hit for sales and see if you are on track. Trace your buyer’s journey from initial click to purchase. If they drop off at checkout, fix checkout.
Performance numbers tell you if your promos are working or require a change. Ecommerce brands, in particular, need hard data to determine if ads convert viewers to buyers.
How to Improve Your Metrics
It takes planning, careful study, and constant tweaks to improve Facebook ad metrics. Every metric paints a tiny piece of a larger narrative, assisting marketers in identifying the effective and ineffective elements.
Here’s a breakdown of practical steps to boost performance based on real-world approaches:
- Get in the habit of reviewing your key metrics regularly. That means monitoring trends in click-through rates, cost per click, conversions, and frequency.
- Concentrate solely on metrics that connect to your objectives. This prevents you from getting swept away in the tumult of vanity stats and allows you to notice what counts for growth.
- Dig into the customer journey and leverage attribution data to see how buyers engage with your ads. This reveals where the path to purchase is slick and where it needs lubricating.
- Employ data visualization tools to help you identify patterns and trends. A straightforward dashboard makes decision making quicker.
- Automate reports and insight. It saves time and delivers real-time alerts when something changes so you can act quickly.
- Shift budget to performing ads and audiences. Pause or scale back on low performers to keep your spending working smarter.
- Be on the lookout for ad fatigue. If your frequency gets too high, over five, spice up your creative to keep costs low and engagement high.
- When you see platform updates or new trends, be sure to review and update your strategies. Tiny shifts can generate huge effects over months and years.
Offer Optimization
- Try discounts, free shipping, bundles, urgency, or loyalty rewards.
- Use conversion and cost per acquisition data to select your winners.
- Change offers based on what customers say and do.
- Watch offer-specific metrics, like redemption or click rates, to finesse.
Select offers that align with what your audience appreciates. If a free trial beats a discount, use that information on subsequent ads.
Adjust according to feedback and keep offers fresh to prevent wearout.
The Attribution Puzzle
Figuring out which ad or channel should receive credit for a sale is hard, even for savvy marketers. This is the crux of the attribution conundrum. Customers don’t purchase in a straight line. They tap an ad on their phone, read a post on their laptop, and perhaps search for your brand days later.
Every step counts, but attributing it all to the last click discounts the effort of every other touchpoint. Paid platforms typically want to take as much credit as they can, so it’s up to us to investigate a little deeper.
|
Attribution Model |
How It Works |
Pros |
Cons |
|---|---|---|---|
|
Last-Click |
Credit goes to the last touchpoint |
Simple, easy to measure |
Misses earlier influences, overvalues final step |
|
First-Click |
Credit goes to the first touchpoint |
Highlights discovery phase |
Ignores nurturing, undervalues closing efforts |
|
Linear |
Equal credit to all touchpoints |
Shows full journey |
Can dilute importance of key steps |
|
Position-Based |
Most credit to first/last, rest split |
Balances discovery and close |
Can be arbitrary, still misses some nuance |
|
Time Decay |
More credit to recent touchpoints |
Reflects recency, good for short cycles |
Can ignore early brand-building |
Attribution Windows
An attribution window is how long you check if someone converts after clicking your ad. Choose the wrong window, and you stand to overlook important data. A 1-day window only includes early purchasers.
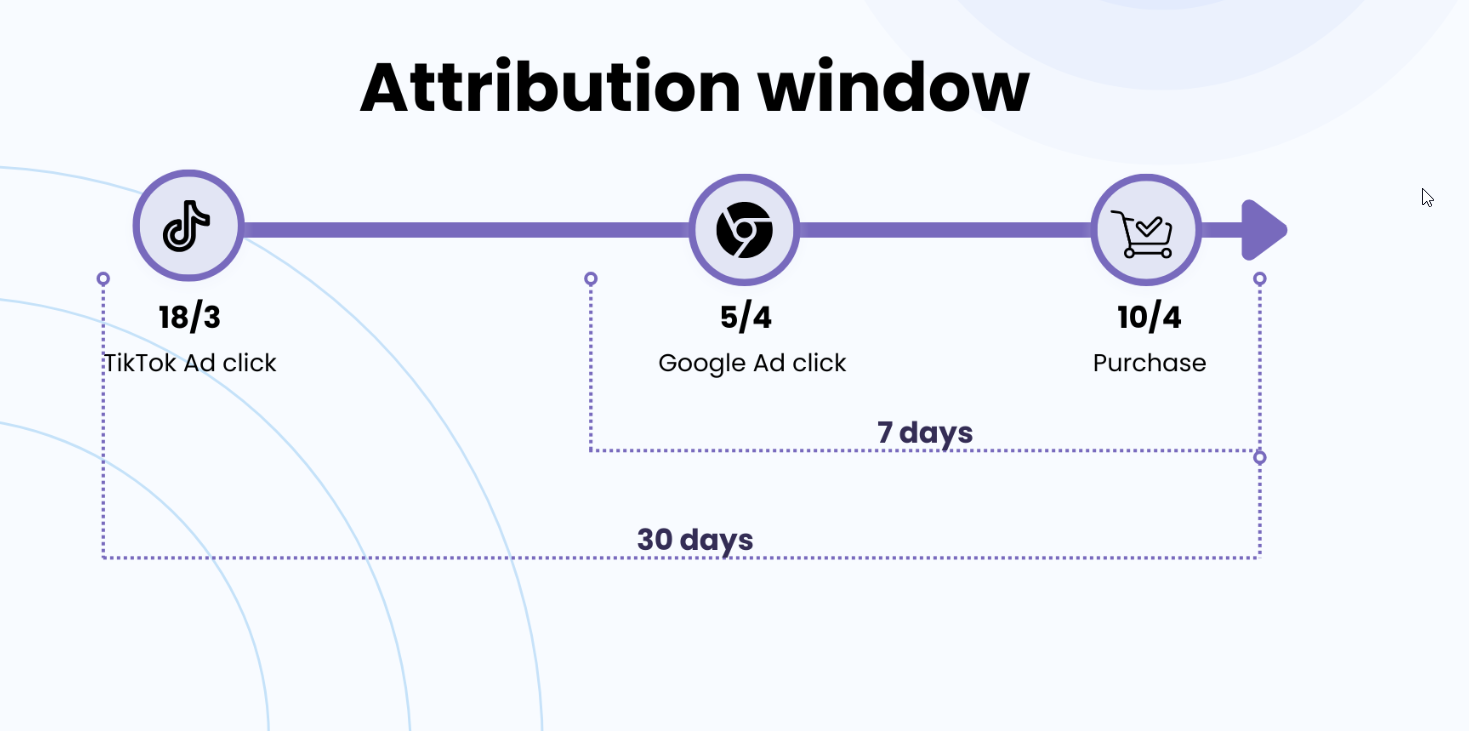
A 7-day window captures those who require thinking time. Multi-day windows, where some brands go as far as 28 days, provide the full perspective. The correct window is sales-cycle and sell-dependent.
Track which window mimics your buyers’ actual behavior. If conversions spike after day 3, your data may look lame with a 1-day window. Other brands time shift based on these insights, aiming ads to coincide with when buyers act.
Armed with these insights, you can shift budgets or bids to better align with how long it takes your customers to decide.
Cross-Channel Impact

Most purchasers don’t remain in one lane. They might initially encounter a Facebook ad, then do a Google search and then tap on a retargeting ad days later. Each channel pushes them toward purchase.
If you just look at last-click, you may chop budgets of channels that assist early. Winning teams attribute every touch and analyze channel synergy. For instance, perhaps your Facebook ad initiates the conversation, but email seals the deal.
Contrast information across multiple sites and devices. Cross-channel reporting provides a reality check for what’s working. With this, you can move your budget to where it truly matters, not just the last click.
Watch for how mobile, desktop, and even in-store activity converges. These touchpoints accumulate in ways that mono-channel data cannot display.
Conclusion
Good Facebook ad metrics keep it real. Clicks, reach, and cost per click provide a great view into what’s working. A smart dashboard makes figures simple to watch. Each objective requires the appropriate metric. Peddling a product is inherently different than culturing a fan base. Numbers tell a story, but so does people’s behavior after they click. One agency in Austin saw ad tweaks increase sign-ups by 50% in just two weeks. Little changes can ignite big victories. Keep an eye on the data, but trust your instinct as well. Ready to find out what your ads can do? Test a couple of tips from above and see your numbers transform quickly. For additional assistance, contact the experts at SirLinksALot.
Frequently Asked Questions
What are the most important Facebook ad metrics to track?
The key performance metrics for your Facebook ads include CTR, conversion rates, CPC, cost per conversion, and ROAS, which help track engagement and overall campaign performance.
How can I align Facebook ad metrics with my business goals?
Select important metrics that mirror your objectives. For brand awareness, focus on reach and impressions, while for sales, monitor conversion rates and overall revenue. Always tie performance metrics back to the desired outcome.
Why should I use a custom dashboard for Facebook ad metrics?
A custom dashboard lets you monitor only the important metrics that matter to your enterprise, such as facebook ads metrics and performance insights. It saves time, eliminates confusion, and helps you make better marketing choices fast.
What is attribution in Facebook ads, and why does it matter?
Attribution highlights which facebook ads drive conversions. By understanding attribution, you will know what ads perform best and where to allocate your budget for greater impact.
How can I improve my Facebook ad metrics?
Try various photographs, copy, or target groups while tracking important facebook ads metrics. Constantly monitor your performance metrics and optimize accordingly. Ongoing tuning gets you further.
What does a high click-through rate (CTR) indicate?
A high CTR is an important metric that indicates your ad is resonating with your audience, showing that people want to click and learn more about your offer.
Is cost per click (CPC) the only metric that matters?
No, CPC is important but not the only metric. Consider conversion rates, cost per conversion, and important Facebook ads metrics to really understand your ad performance.